EKS 오토스케일링
April 2024 (5342 Words, 30 Minutes)
EKS Autoscaling
AutoScaling 이야기 시작합니다.
우선 실습에 앞서 클러스터 프로비저닝을 진행합니다.
# default 네임스페이스 적용
kubectl ns default

# 노드 정보 확인 : t3.medium
kubectl get node --label-columns=node.kubernetes.io/instance-type,eks.amazonaws.com/capacityType,topology.kubernetes.io/zone

# ExternalDNS
MyDomain=montkim.org
MyDnzHostedZoneId=$(aws route53 list-hosted-zones-by-name --dns-name "${MyDomain}." --query "HostedZones[0].Id" --output text)
echo $MyDomain, $MyDnzHostedZoneId
curl -s -O https://raw.githubusercontent.com/gasida/PKOS/main/aews/externaldns.yaml
MyDomain=$MyDomain MyDnzHostedZoneId=$MyDnzHostedZoneId envsubst < externaldns.yaml | kubectl apply -f -

# kube-ops-view
helm repo add geek-cookbook https://geek-cookbook.github.io/charts/
helm install kube-ops-view geek-cookbook/kube-ops-view --version 1.2.2 --set env.TZ="Asia/Seoul" --namespace kube-system
kubectl patch svc -n kube-system kube-ops-view -p '{"spec":{"type":"LoadBalancer"}}'
kubectl annotate service kube-ops-view -n kube-system "external-dns.alpha.kubernetes.io/hostname=kubeopsview.$MyDomain"
echo -e "Kube Ops View URL = http://kubeopsview.$MyDomain:8080/#scale=1.5"

# AWS LB Controller
helm repo add eks https://aws.github.io/eks-charts
helm repo update
helm install aws-load-balancer-controller eks/aws-load-balancer-controller -n kube-system --set clusterName=$CLUSTER_NAME \
  --set serviceAccount.create=false --set serviceAccount.name=aws-load-balancer-controller

# gp3 스토리지 클래스 생성
kubectl apply -f https://raw.githubusercontent.com/gasida/PKOS/main/aews/gp3-sc.yaml

# 노드 보안그룹 ID 확인
NGSGID=$(aws ec2 describe-security-groups --filters Name=group-name,Values=*ng1* --query "SecurityGroups[*].[GroupId]" --output text)
aws ec2 authorize-security-group-ingress --group-id $NGSGID --protocol '-1' --cidr 192.168.1.100/32
이유는 모르겠지만, 도메인 갯수가 한개가 아니고, 이미 온프레미스에서 montkim.com 이라는 도메인을 사용중이다보니, aews.montkim.com 이라는 서브도메인으로는 DNS 컨트롤이 잘 안되는듯해 도메인을 하나 추가로 구매했습니다.
#도메인 재지정
MyDomain=montkim.org

# 사용 리전의 인증서 ARN 확인
CERT_ARN=arn:aws:acm:ap-northeast-2:<AWS_ID>:certificate/<Random Info>

MyDnzHostedZoneId=$(aws route53 list-hosted-zones-by-name --dns-name "${MyDomain}." --query "HostedZones[0].Id" --output text)
echo $MyDomain, $MyDnzHostedZoneId
curl -s -O https://raw.githubusercontent.com/gasida/PKOS/main/aews/externaldns.yaml
MyDomain=$MyDomain MyDnzHostedZoneId=$MyDnzHostedZoneId envsubst < externaldns.yaml | kubectl apply -f -
이제 다시 external dns를 배포합니다.
node viewer 설치
# go 설치
wget https://go.dev/dl/go1.22.1.linux-amd64.tar.gz
tar -C /usr/local -xzf go1.22.1.linux-amd64.tar.gz
export PATH=$PATH:/usr/local/go/bin
go version
go version go1.22.1 linux/amd64

# EKS Node Viewer 설치 : 약 2분 이상 소요
go install github.com/awslabs/eks-node-viewer/cmd/eks-node-viewer@latest

# [신규 터미널] EKS Node Viewer 접속
cd ~/go/bin && ./eks-node-viewer
혹은
cd ~/go/bin && ./eks-node-viewer --resources cpu,memory

명령 샘플
# Standard usage
./eks-node-viewer

# Display both CPU and Memory Usage
./eks-node-viewer --resources cpu,memory

# Karenter nodes only
./eks-node-viewer --node-selector "karpenter.sh/provisioner-name"

# Display extra labels, i.e. AZ
./eks-node-viewer --extra-labels topology.kubernetes.io/zone

# Specify a particular AWS profile and region
AWS_PROFILE=myprofile AWS_REGION=us-west-2

기본 옵션
# select only Karpenter managed nodes
node-selector=karpenter.sh/provisioner-name

# display both CPU and memory
resources=cpu,memory
node viewer 를 이용하면 노드정보 및 가격정책(spot가격 포함)을 가시적으로 볼 수 있게 해주는 패키지입니다.
온프레미스에서는 cli 대시보드처럼 가시적인 리소스사용량을… 표시하기엔 부적합하네요
오토스케일링되는 리소스들을 가시적으로 보기위해 monitoring 오픈소스를 설치해줍니다.
# repo 추가
helm repo add prometheus-community https://prometheus-community.github.io/helm-charts

# 파라미터 파일 생성 : PV/PVC(AWS EBS) 삭제에 불편하니, 4주차 실습과 다르게 PV/PVC 미사용
cat <<EOT > monitor-values.yaml
prometheus:
  prometheusSpec:
    podMonitorSelectorNilUsesHelmValues: false
    serviceMonitorSelectorNilUsesHelmValues: false
    retention: 5d
    retentionSize: "10GiB"

  verticalPodAutoscaler:
    enabled: true

  ingress:
    enabled: true
    ingressClassName: alb
    hosts:
      - prometheus.$MyDomain
    paths:
      - /*
    annotations:
      alb.ingress.kubernetes.io/scheme: internet-facing
      alb.ingress.kubernetes.io/target-type: ip
      alb.ingress.kubernetes.io/listen-ports: '[{"HTTPS":443}, {"HTTP":80}]'
      alb.ingress.kubernetes.io/certificate-arn: $CERT_ARN
      alb.ingress.kubernetes.io/success-codes: 200-399
      alb.ingress.kubernetes.io/load-balancer-name: myeks-ingress-alb
      alb.ingress.kubernetes.io/group.name: study
      alb.ingress.kubernetes.io/ssl-redirect: '443'

grafana:
  defaultDashboardsTimezone: Asia/Seoul
  adminPassword: prom-operator
  defaultDashboardsEnabled: false

  ingress:
    enabled: true
    ingressClassName: alb
    hosts:
      - grafana.$MyDomain
    paths:
      - /*
    annotations:
      alb.ingress.kubernetes.io/scheme: internet-facing
      alb.ingress.kubernetes.io/target-type: ip
      alb.ingress.kubernetes.io/listen-ports: '[{"HTTPS":443}, {"HTTP":80}]'
      alb.ingress.kubernetes.io/certificate-arn: $CERT_ARN
      alb.ingress.kubernetes.io/success-codes: 200-399
      alb.ingress.kubernetes.io/load-balancer-name: myeks-ingress-alb
      alb.ingress.kubernetes.io/group.name: study
      alb.ingress.kubernetes.io/ssl-redirect: '443'

kube-state-metrics:
  rbac:
    extraRules:
      - apiGroups: ["autoscaling.k8s.io"]
        resources: ["verticalpodautoscalers"]
        verbs: ["list", "watch"]
  prometheus:
    monitor:
      enabled: true
  customResourceState:
    enabled: true
    config:
      kind: CustomResourceStateMetrics
      spec:
        resources:
          - groupVersionKind:
              group: autoscaling.k8s.io
              kind: "VerticalPodAutoscaler"
              version: "v1"
            labelsFromPath:
              verticalpodautoscaler: [metadata, name]
              namespace: [metadata, namespace]
              target_api_version: [apiVersion]
              target_kind: [spec, targetRef, kind]
              target_name: [spec, targetRef, name]
            metrics:
              - name: "vpa_containerrecommendations_target"
                help: "VPA container recommendations for memory."
                each:
                  type: Gauge
                  gauge:
                    path: [status, recommendation, containerRecommendations]
                    valueFrom: [target, memory]
                    labelsFromPath:
                      container: [containerName]
                commonLabels:
                  resource: "memory"
                  unit: "byte"
              - name: "vpa_containerrecommendations_target"
                help: "VPA container recommendations for cpu."
                each:
                  type: Gauge
                  gauge:
                    path: [status, recommendation, containerRecommendations]
                    valueFrom: [target, cpu]
                    labelsFromPath:
                      container: [containerName]
                commonLabels:
                  resource: "cpu"
                  unit: "core"
  selfMonitor:
    enabled: true

alertmanager:
  enabled: false
EOT
cat monitor-values.yaml | yh

# 배포
kubectl create ns monitoring
helm install kube-prometheus-stack prometheus-community/kube-prometheus-stack --version 57.2.0 \
--set prometheus.prometheusSpec.scrapeInterval='15s' --set prometheus.prometheusSpec.evaluationInterval='15s' \
-f monitor-values.yaml --namespace monitoring

# Metrics-server 배포
kubectl apply -f https://github.com/kubernetes-sigs/metrics-server/releases/latest/download/components.yaml

# 프로메테우스 ingress 도메인으로 웹 접속
echo -e "Prometheus Web URL = https://prometheus.$MyDomain"

# 그라파나 웹 접속 : 기본 계정 - admin / prom-operator
echo -e "Grafana Web URL = https://grafana.$MyDomain"
배포 완료 후 그라파나에 들어가서 테스트 해볼 메트릭들에 맞는 Dashboard를 import 해줍니다.
권장하는 Dashboard로는 15757 17900 15172 대시보드입니다
Pod Autoscaling
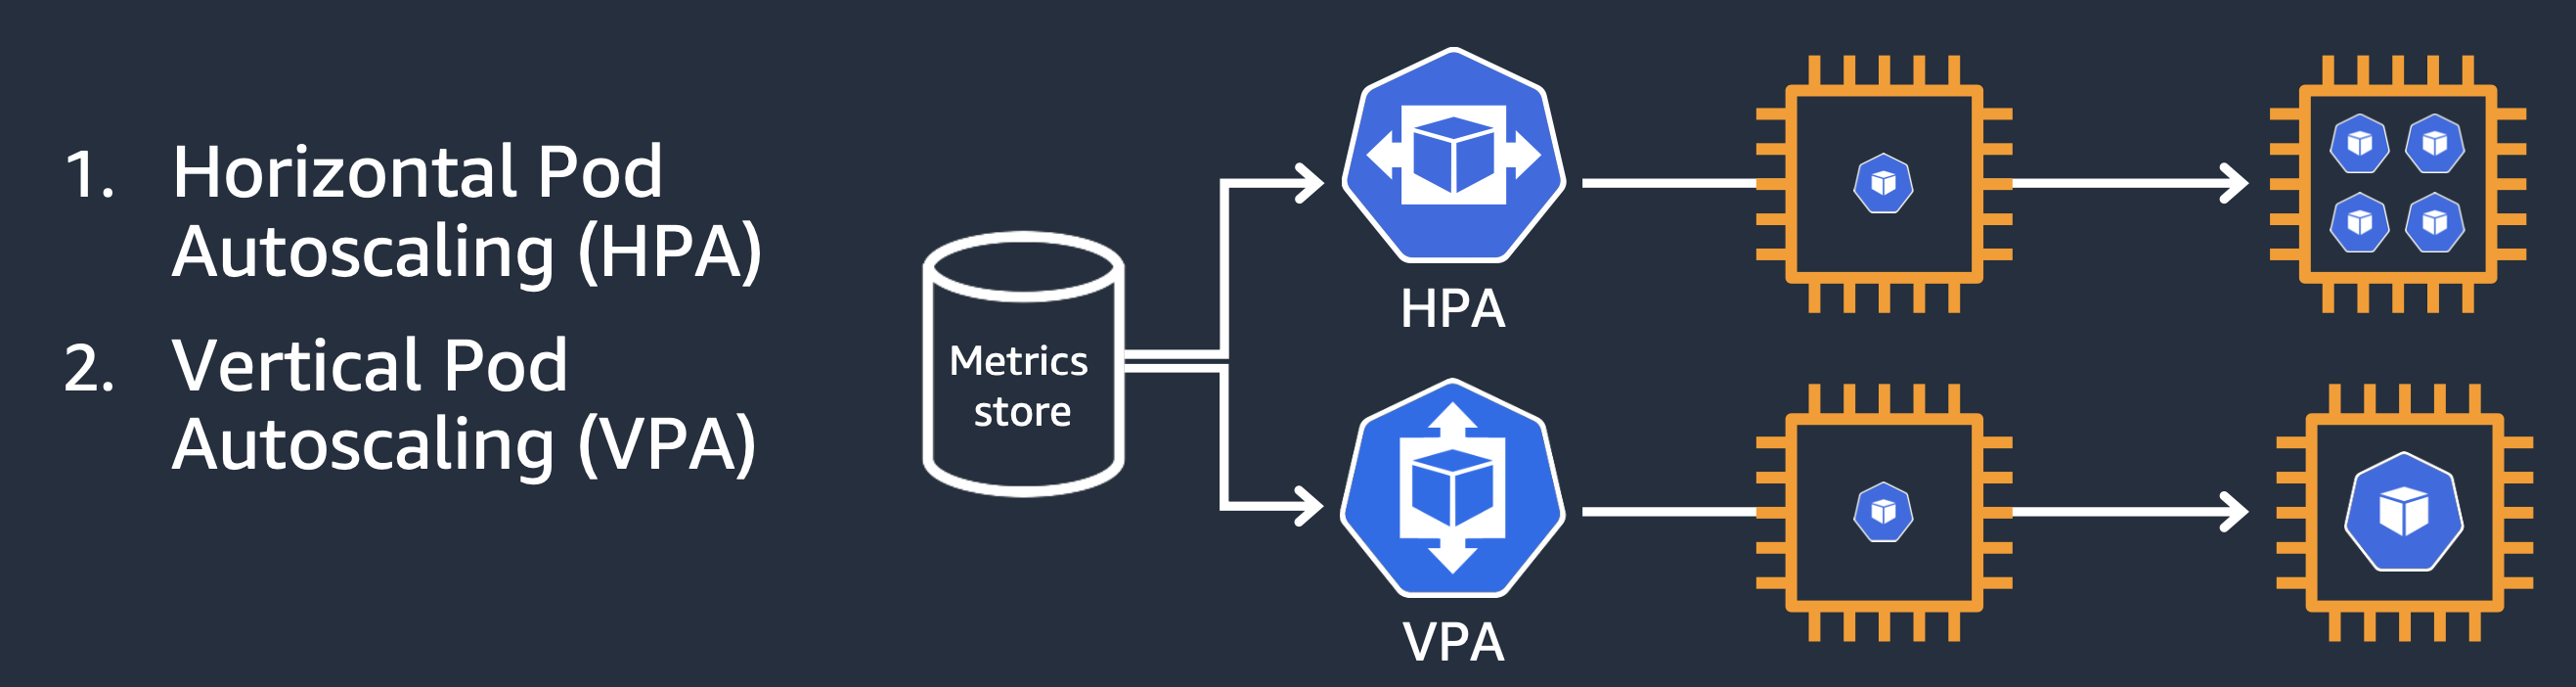
현재 쿠버네티스의 파드 오토스케일링은 두가지가 존재합니다.
수직 오토스케일링, 수평 오토스케일링인데요, 먼저 수평 오토스케일링부터 알아보겠습니다.
HPA
HPA는 다음과 같은 방식으로 동작합니다.
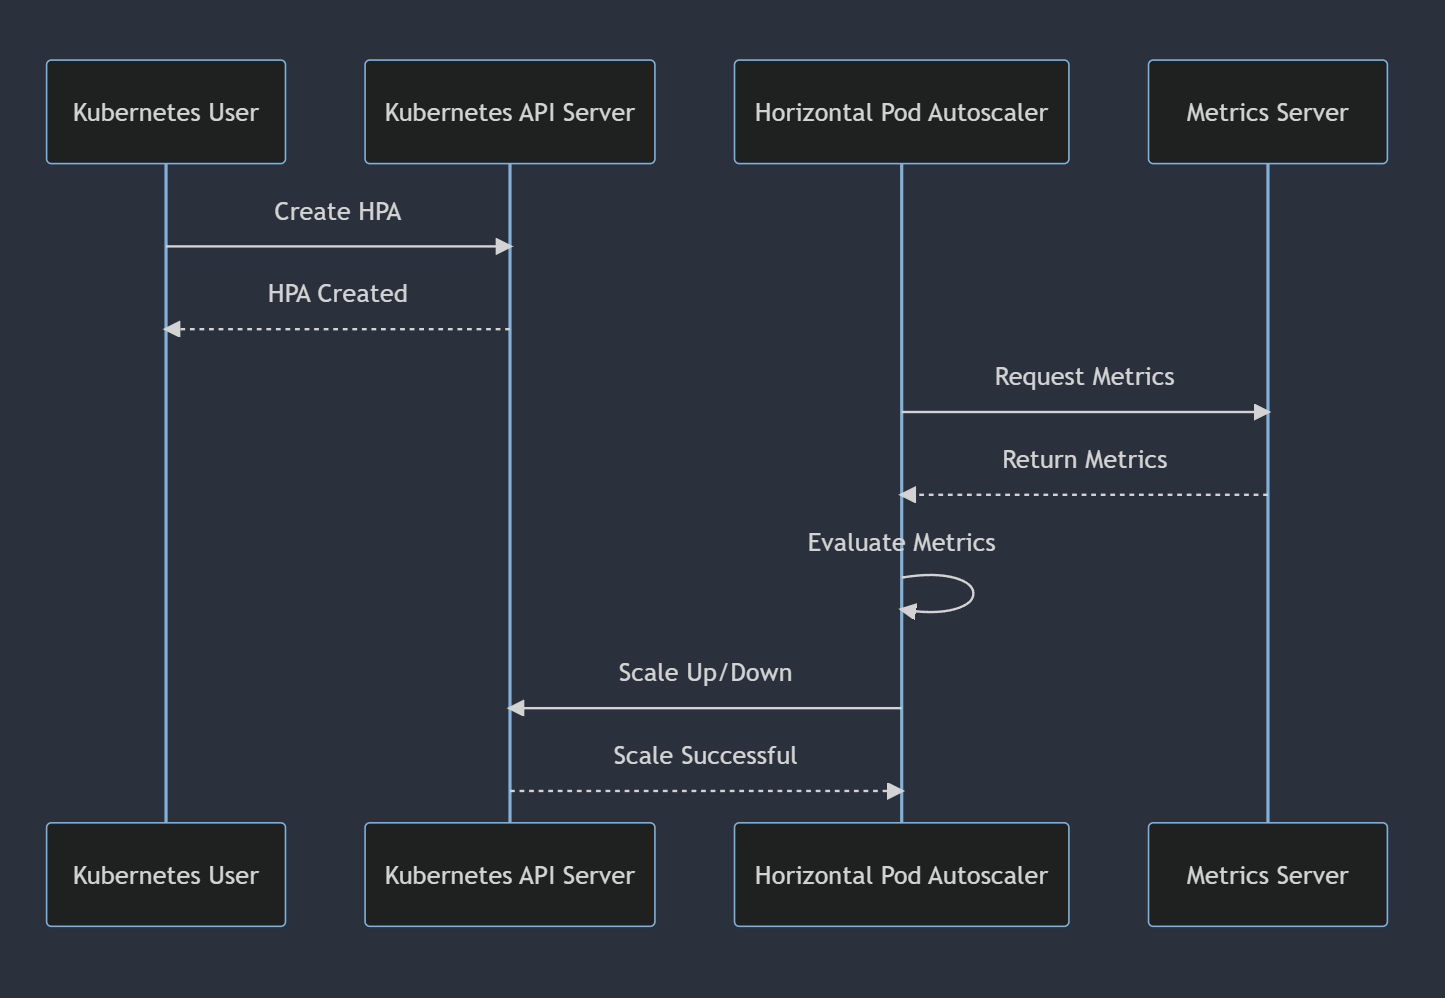
metric server에 의해 수집되는 메트릭들을 기반으로 설정된 HPA 기준에 만족하면 Autoscaling을 진행합니다.
알고리즘 세부 정보
가장 기본적인 관점에서, HorizontalPodAutoscaler 컨트롤러는 원하는(desired) 메트릭 값과 현재(current) 메트릭 값 사이의 비율로 작동합니다.
원하는 레플리카 수 = ceil[현재 레플리카 수 * ( 현재 메트릭 값 / 원하는 메트릭 값 )]
테스트를 진행해보기전에, 앞서 새로운 그라파나 대시보드에서 진행을 해보겠습니다.
17125 대시보드이지만, EKS에서의 메트릭과 조금 다른부분이 있어 직접 json 파일을 import해주도록 하겠습니다.
{
  "__inputs": [],
  "__requires": [
    {
      "type": "grafana",
      "id": "grafana",
      "name": "Grafana",
      "version": "6.1.6"
    },
    {
      "type": "panel",
      "id": "graph",
      "name": "Graph",
      "version": ""
    },
    {
      "type": "datasource",
      "id": "prometheus",
      "name": "Prometheus",
      "version": "1.0.0"
    },
    {
      "type": "panel",
      "id": "singlestat",
      "name": "Singlestat",
      "version": ""
    }
  ],
  "annotations": {
    "list": [
      {
        "builtIn": 1,
        "datasource": "-- Grafana --",
        "enable": true,
        "hide": true,
        "iconColor": "rgba(0, 211, 255, 1)",
        "name": "Annotations & Alerts",
        "type": "dashboard"
      }
    ]
  },
  "editable": true,
  "gnetId": 17125,
  "graphTooltip": 0,
  "id": null,
  "iteration": 1558717029334,
  "links": [],
  "panels": [
    {
      "cacheTimeout": null,
      "colorBackground": false,
      "colorValue": false,
      "colors": [
        "#299c46",
        "rgba(237, 129, 40, 0.89)",
        "#d44a3a"
      ],
      "datasource": "$datasource",
      "format": "none",
      "gauge": {
        "maxValue": 100,
        "minValue": 0,
        "show": false,
        "thresholdLabels": false,
        "thresholdMarkers": true
      },
      "id": 5,
      "interval": null,
      "links": [],
      "mappingType": 1,
      "mappingTypes": [
        {
          "name": "value to text",
          "value": 1
        },
        {
          "name": "range to text",
          "value": 2
        }
      ],
      "maxDataPoints": 100,
      "nullPointMode": "connected",
      "nullText": null,
      "postfix": "",
      "postfixFontSize": "50%",
      "prefix": "",
      "prefixFontSize": "50%",
      "rangeMaps": [
        {
          "from": "null",
          "text": "N/A",
          "to": "null"
        }
      ],
      "sparkline": {
        "fillColor": "rgba(31, 118, 189, 0.18)",
        "full": false,
        "lineColor": "rgb(31, 120, 193)",
        "show": true
      },
      "tableColumn": "",
      "targets": [
        {
          "expr": "kube_horizontalpodautoscaler_status_desired_replicas{job=\"kube-state-metrics\", namespace=\"$namespace\"}",
          "format": "time_series",
          "intervalFactor": 2,
          "legendFormat": "",
          "refId": "A"
        }
      ],
      "thresholds": "",
      "title": "Desired Replicas",
      "type": "singlestat",
      "valueFontSize": "80%",
      "valueMaps": [
        {
          "op": "=",
          "text": "0",
          "value": "null"
        }
      ],
      "valueName": "current"
    },
    {
      "cacheTimeout": null,
      "colorBackground": false,
      "colorValue": false,
      "colors": [
        "#299c46",
        "rgba(237, 129, 40, 0.89)",
        "#d44a3a"
      ],
      "datasource": "$datasource",
      "format": "none",
      "gauge": {
        "maxValue": 100,
        "minValue": 0,
        "show": false,
        "thresholdLabels": false,
        "thresholdMarkers": true
      },
      "gridPos": {
        "h": 3,
        "w": 6,
        "x": 6,
        "y": 0
      },
      "id": 6,
      "interval": null,
      "links": [],
      "mappingType": 1,
      "mappingTypes": [
        {
          "name": "value to text",
          "value": 1
        },
        {
          "name": "range to text",
          "value": 2
        }
      ],
      "maxDataPoints": 100,
      "nullPointMode": "connected",
      "nullText": null,
      "postfix": "",
      "postfixFontSize": "50%",
      "prefix": "",
      "prefixFontSize": "50%",
      "rangeMaps": [
        {
          "from": "null",
          "text": "N/A",
          "to": "null"
        }
      ],
      "sparkline": {
        "fillColor": "rgba(31, 118, 189, 0.18)",
        "full": false,
        "lineColor": "rgb(31, 120, 193)",
        "show": true
      },
      "tableColumn": "",
      "targets": [
        {
          "expr": "kube_horizontalpodautoscaler_status_current_replicas{job=\"kube-state-metrics\", namespace=\"$namespace\"}",
          "format": "time_series",
          "intervalFactor": 2,
          "legendFormat": "",
          "refId": "A"
        }
      ],
      "thresholds": "",
      "title": "Current Replicas",
      "type": "singlestat",
      "valueFontSize": "80%",
      "valueMaps": [
        {
          "op": "=",
          "text": "0",
          "value": "null"
        }
      ],
      "valueName": "current"
    },
    {
      "cacheTimeout": null,
      "colorBackground": false,
      "colorValue": false,
      "colors": [
        "#299c46",
        "rgba(237, 129, 40, 0.89)",
        "#d44a3a"
      ],
      "datasource": "$datasource",
      "format": "none",
      "gauge": {
        "maxValue": 100,
        "minValue": 0,
        "show": false,
        "thresholdLabels": false,
        "thresholdMarkers": true
      },
      "gridPos": {
        "h": 3,
        "w": 6,
        "x": 12,
        "y": 0
      },
      "id": 7,
      "interval": null,
      "links": [],
      "mappingType": 1,
      "mappingTypes": [
        {
          "name": "value to text",
          "value": 1
        },
        {
          "name": "range to text",
          "value": 2
        }
      ],
      "maxDataPoints": 100,
      "nullPointMode": "connected",
      "nullText": null,
      "postfix": "",
      "postfixFontSize": "50%",
      "prefix": "",
      "prefixFontSize": "50%",
      "rangeMaps": [
        {
          "from": "null",
          "text": "N/A",
          "to": "null"
        }
      ],
      "sparkline": {
        "fillColor": "rgba(31, 118, 189, 0.18)",
        "full": false,
        "lineColor": "rgb(31, 120, 193)",
        "show": false
      },
      "tableColumn": "",
      "targets": [
        {
          "expr": "kube_horizontalpodautoscaler_spec_min_replicas{job=\"kube-state-metrics\",  namespace=\"$namespace\"}",
          "format": "time_series",
          "intervalFactor": 2,
          "legendFormat": "",
          "refId": "A"
        }
      ],
      "thresholds": "",
      "title": "Min Replicas",
      "type": "singlestat",
      "valueFontSize": "80%",
      "valueMaps": [
        {
          "op": "=",
          "text": "0",
          "value": "null"
        }
      ],
      "valueName": "current"
    },
    {
      "cacheTimeout": null,
      "colorBackground": false,
      "colorValue": false,
      "colors": [
        "#299c46",
        "rgba(237, 129, 40, 0.89)",
        "#d44a3a"
      ],
      "datasource": "$datasource",
      "format": "none",
      "gauge": {
        "maxValue": 100,
        "minValue": 0,
        "show": false,
        "thresholdLabels": false,
        "thresholdMarkers": true
      },
      "gridPos": {
        "h": 3,
        "w": 6,
        "x": 18,
        "y": 0
      },
      "id": 8,
      "interval": null,
      "links": [],
      "mappingType": 1,
      "mappingTypes": [
        {
          "name": "value to text",
          "value": 1
        },
        {
          "name": "range to text",
          "value": 2
        }
      ],
      "maxDataPoints": 100,
      "nullPointMode": "connected",
      "nullText": null,
      "postfix": "",
      "postfixFontSize": "50%",
      "prefix": "",
      "prefixFontSize": "50%",
      "rangeMaps": [
        {
          "from": "null",
          "text": "N/A",
          "to": "null"
        }
      ],
      "sparkline": {
        "fillColor": "rgba(31, 118, 189, 0.18)",
        "full": false,
        "lineColor": "rgb(31, 120, 193)",
        "show": false
      },
      "tableColumn": "",
      "targets": [
        {
          "expr": "kube_horizontalpodautoscaler_spec_max_replicas{job=\"kube-state-metrics\"}",
          "format": "time_series",
          "intervalFactor": 2,
          "legendFormat": "",
          "refId": "A"
        }
      ],
      "thresholds": "",
      "title": "Max Replicas",
      "type": "singlestat",
      "valueFontSize": "80%",
      "valueMaps": [
        {
          "op": "=",
          "text": "0",
          "value": "null"
        }
      ],
      "valueName": "current"
    },
    {
      "aliasColors": {},
      "bars": false,
      "dashLength": 10,
      "dashes": false,
      "datasource": "$datasource",
      "fill": 0,
      "gridPos": {
        "h": 12,
        "w": 24,
        "x": 0,
        "y": 3
      },
      "id": 9,
      "legend": {
        "alignAsTable": false,
        "avg": false,
        "current": false,
        "max": false,
        "min": false,
        "rightSide": false,
        "show": true,
        "total": false,
        "values": false
      },
      "lines": true,
      "linewidth": 1,
      "links": [],
      "nullPointMode": "null",
      "paceLength": 10,
      "percentage": false,
      "pointradius": 5,
      "points": false,
      "renderer": "flot",
      "repeat": null,
      "seriesOverrides": [
        {
          "alias": "Max",
          "color": "#C4162A"
        },
        {
          "alias": "Min",
          "color": "#1F60C4"
        }
      ],
      "spaceLength": 10,
      "stack": false,
      "steppedLine": false,
      "targets": [
        {
          "expr": "kube_horizontalpodautoscaler_status_desired_replicas{job=\"kube-state-metrics\",namespace=\"$namespace\"}",
          "format": "time_series",
          "intervalFactor": 2,
          "legendFormat": "Desired",
          "refId": "B"
        },
        {
          "expr": "kube_horizontalpodautoscaler_status_current_replicas{job=\"kube-state-metrics\",namespace=\"$namespace\"}",
          "format": "time_series",
          "intervalFactor": 2,
          "legendFormat": "Running",
          "refId": "C"
        },
        {
          "expr": "kube_horizontalpodautoscaler_spec_max_replicas{job=\"kube-state-metrics\",namespace=\"$namespace\"}",
          "format": "time_series",
          "instant": false,
          "intervalFactor": 2,
          "legendFormat": "Max",
          "refId": "A"
        },
        {
          "expr": "kube_horizontalpodautoscaler_spec_min_replicas{job=\"kube-state-metrics\",namespace=\"$namespace\"}",
          "format": "time_series",
          "instant": false,
          "intervalFactor": 2,
          "legendFormat": "Min",
          "refId": "D"
        }
      ],
      "thresholds": [],
      "timeFrom": null,
      "timeRegions": [],
      "timeShift": null,
      "title": "Replicas",
      "tooltip": {
        "shared": true,
        "sort": 0,
        "value_type": "individual"
      },
      "type": "graph",
      "xaxis": {
        "buckets": null,
        "mode": "time",
        "name": null,
        "show": true,
        "values": []
      },
      "yaxes": [
        {
          "format": "short",
          "label": null,
          "logBase": 1,
          "max": null,
          "min": null,
          "show": true
        },
        {
          "format": "short",
          "label": null,
          "logBase": 1,
          "max": null,
          "min": null,
          "show": true
        }
      ],
      "yaxis": {
        "align": false,
        "alignLevel": null
      }
    }
  ],
  "refresh": "10s",
  "schemaVersion": 18,
  "style": "dark",
  "tags": [],
  "templating": {
    "list": [
      {
        "current": {
          "text": "Prometheus",
          "value": "Prometheus"
        },
        "hide": 0,
        "includeAll": false,
        "label": null,
        "multi": false,
        "name": "datasource",
        "options": [],
        "query": "prometheus",
        "refresh": 1,
        "regex": "",
        "skipUrlSync": false,
        "type": "datasource"
      },
      {
        "allValue": null,
        "current": {},
        "datasource": "$datasource",
        "definition": "label_values(kube_horizontalpodautoscaler_metadata_generation{job=\"kube-state-metrics\"}, namespace)",
        "hide": 0,
        "includeAll": false,
        "label": "Namespace",
        "multi": false,
        "name": "namespace",
        "options": [],
        "query": "label_values(kube_horizontalpodautoscaler_metadata_generation{job=\"kube-state-metrics\"}, namespace)",
        "refresh": 2,
        "regex": "",
        "skipUrlSync": false,
        "sort": 0,
        "tagValuesQuery": "",
        "tags": [],
        "tagsQuery": "",
        "type": "query",
        "useTags": false
      },
      {
        "allValue": null,
        "current": {},
        "datasource": "$datasource",
        "definition": "label_values(kube_horizontalpodautoscaler_labels{job=\"kube-state-metrics\", namespace=\"$namespace\"}, horizontalpodautoscaler)",
        "hide": 0,
        "includeAll": false,
        "label": "Name",
        "multi": false,
        "name": "horizontalpodautoscaler",
        "options": [],
        "query": "label_values(kube_horizontalpodautoscaler_labels{job=\"kube-state-metrics\", namespace=\"$namespace\"}, horizontalpodautoscaler)",
        "refresh": 2,
        "regex": "",
        "skipUrlSync": false,
        "sort": 0,
        "tagValuesQuery": "",
        "tags": [],
        "tagsQuery": "",
        "type": "query",
        "useTags": false
      }
    ]
  },
  "time": {
    "from": "now-1h",
    "to": "now"
  },
  "timepicker": {
    "refresh_intervals": [
      "5s",
      "10s",
      "30s",
      "1m",
      "5m",
      "15m",
      "30m",
      "1h",
      "2h",
      "1d"
    ],
    "time_options": [
      "5m",
      "15m",
      "1h",
      "6h",
      "12h",
      "24h",
      "2d",
      "7d",
      "30d"
    ]
  },
  "timezone": "",
  "title": "Kubernetes / Horizontal Pod Autoscaler",
  "uid": "alJY6yWZz",
  "version": 10,
  "description": "A quick and simple dashboard for viewing how your horizontal pod autoscaler is doing."
}
일부 메트릭들이 달라 dashboard가 제대로 표시되지 않을텐데, 직접 한땀씩 수정한게 새삼 대단해보이네요…
HPA용 웹 배포
apiVersion: apps/v1
kind: Deployment
metadata:
  name: php-apache
spec:
  selector:
    matchLabels:
      run: php-apache
  template:
    metadata:
      labels:
        run: php-apache
    spec:
      containers:
      - name: php-apache
        image: registry.k8s.io/hpa-example
        ports:
        - containerPort: 80
        resources:
          limits:
            cpu: 500m
          requests:
            cpu: 200m
---
apiVersion: v1
kind: Service
metadata:
  name: php-apache
  labels:
    run: php-apache
spec:
  ports:
  - port: 80
  selector:
    run: php-apache
부하테스트 진행!
PODIP=$(kubectl get pod -l run=php-apache -o jsonpath={.items[0].status.podIP})
curl -s $PODIP; echo
사실 hey나 기타 cli 기반 부하테스트로 진행해도 좋지만, 간단한 부하만 필요한 경우라 curl 명령어를 반복분으로 실행했습니다.
HPA 설정
# Create the HorizontalPodAutoscaler : requests.cpu=200m - 알고리즘
# Since each pod requests 200 milli-cores by kubectl run, this means an average CPU usage of 100 milli-cores.
kubectl autoscale deployment php-apache --cpu-percent=50 --min=1 --max=10

# HPA 설정 확인
kubectl get hpa php-apache -o yaml | kubectl neat | yh
spec:
  minReplicas: 1               # [4] 또는 최소 1개까지 줄어들 수도 있습니다
  maxReplicas: 10              # [3] 포드를 최대 5개까지 늘립니다
  scaleTargetRef:
    apiVersion: apps/v1
    kind: Deployment
    name: php-apache           # [1] php-apache 의 자원 사용량에서
  metrics:
  - type: Resource
    resource:
      name: cpu
      target:
        type: Utilization
        averageUtilization: 50  # [2] CPU 활용률이 50% 이상인 경우

# 반복 접속 1 (파드1 IP로 접속) >> 증가 확인 후 중지
while true;do curl -s $PODIP; sleep 0.5; done

# 반복 접속 2 (서비스명 도메인으로 접속) >> 증가 확인(몇개까지 증가되는가? 그 이유는?) 후 중지 >> 중지 5분 후 파드 갯수 감소 확인
# Run this in a separate terminal
# so that the load generation continues and you can carry on with the rest of the steps
kubectl run -i --tty load-generator --rm --image=busybox:1.28 --restart=Never -- /bin/sh -c "while sleep 0.01; do wget -q -O- http://php-apache; done"
min, max 값을 설정해 어떤 메트릭을 기준으로 HPA가 동작할지 설정을 진행합니다.

실제로 생성한 리소스는 다음과 같이 조회가 가능하고, metrics server에서 메트릭을 받아와 Target 기준에 부합하게되면 autoscaling event를 발생시킵니다

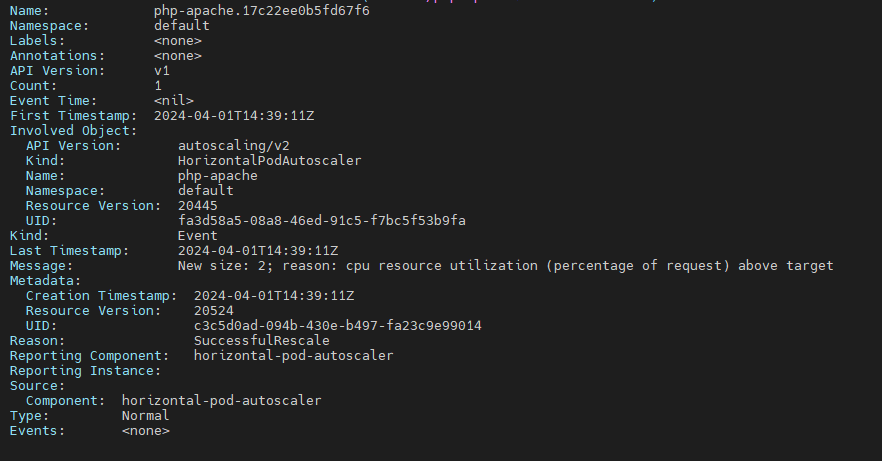
세부 이벤트를 조회해봤습니다. 꽤 상세하게 기록이 남긴합니다.
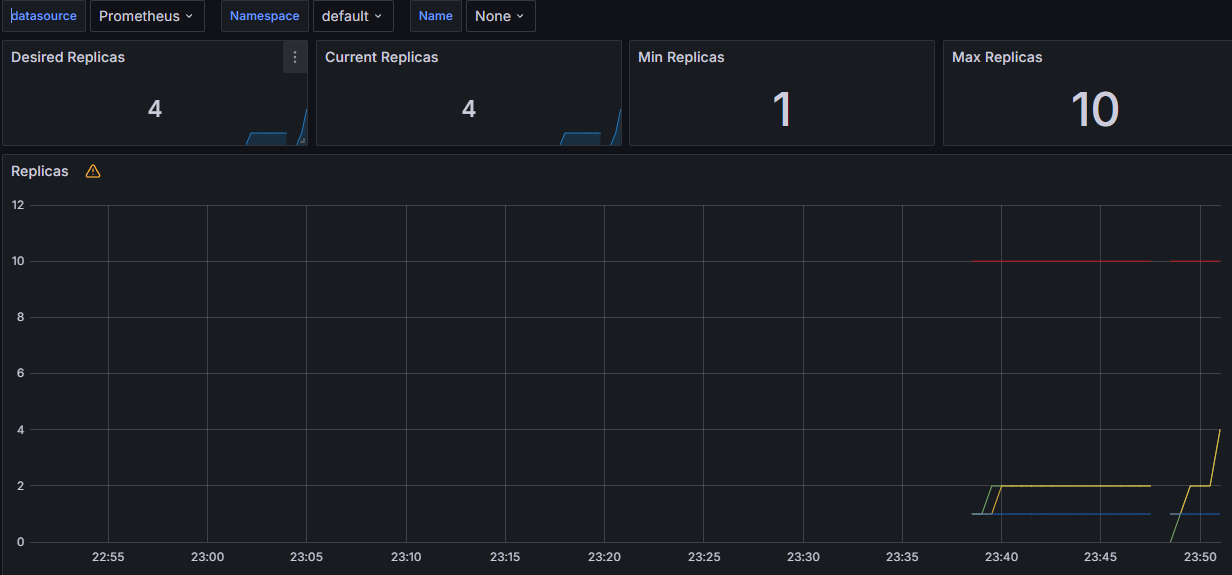
위에서 말했던 dashboard 를 import 해보면 HPA에서 컨트롤하는 replicaset 메트릭을 조회할 수 있습니다.
도전과제
apiVersion: autoscaling/v2
kind: HorizontalPodAutoscaler
metadata:
  name: php-apache
spec:
  minReplicas: 1
  maxReplicas: 10
  scaleTargetRef:
    apiVersion: apps/v1
    kind: Deployment
    name: php-apache
  metrics:
  - type: Resource
    resource:
      name: cpu
      target:
        type: Utilization
        averageUtilization: 50
  - type: Pods
    pods:
      metric:
        name: packets-per-second
      target:
        type: AverageValue
        averageValue: 1k
  - type: Object
    object:
      metric:
        name: requests-per-second
      describedObject:
        apiVersion: networking.k8s.io/v1
        kind: Ingress
        name: main-route
      target:
        type: Value
        value: 10k
HPA V2에서부터는 custom metric을 지원해 다양한 기준들로 HPA 설정을 진행할수있습니다.
https://kubernetes.io/ko/docs/tasks/run-application/horizontal-pod-autoscale/
Metrics
다만 apiVersion: autoscaling/v2가 출시되었기때문에, 새로 작성해봅니다.
apiVersion: autoscaling/v2
kind: HorizontalPodAutoscaler
metadata:
  name: jekyll-hpa
spec:
  scaleTargetRef:
    apiVersion: apps/v1
    kind: Deployment
    name: jekyll-deployment
  minReplicas: 1
  maxReplicas: 10
  metrics:
  - type: Resource
    resource:
      name: cpu
      target:
        type: Utilization
        averageUtilization: 50
targetCPUUtilizationPercentage으로 cpu 할당량을 구체적으로 설정할 수 있는 metrics 배열로 변경되었습니다. 아직은 CPU / 메모리 두개 밖에 사용이 불가능하지만, 추후에는 업데이트가 될 것 같은 생각이 드네요
metrics 에서는 type: Resource로 기존에 있던 targetCPUUtilizationPercentage 를 대체하는 기능 외에도 신규로 생성된 type이 있습니다.
1. 자원 메트릭에 대한 퍼센트 대신 값 지정
이 기능은 CPU와 같은 자원의 사용량에 대해 퍼센트 값을 사용하는 대신, 실제 값으로 명시할 수 있게 해줍니다. 더욱 세밀한 자원 사용률을 기반으로 HPA를 조정 가능해집니다.
예를 들어, 아래는 CPU 사용률을 값으로 명시한 HPA 설정의 예입니다:
metrics:
- type: Resource
  resource:
    name: cpu
    target:
      type: AverageValue
      averageValue: 200m
이 설정은 각 Pod가 평균적으로 200 mill의 CPU를 사용할 때까지 Pod의 수를 늘립니다.
2. 사용자 정의 메트릭
HPA에서 사용자 정의 메트릭을 지원하는 것은 매우 중요합니다. 이를 통해 애플리케이션에 특화된 메트릭에 기반하여 자동 스케일링을 수행할 수 있습니다. 두 가지 주요 사용자 정의 메트릭 타입이 있습니다: Pod 메트릭과 Object 메트릭.
- Pod 메트릭: 이는 각 Pod에 대한 메트릭을 설명합니다. 이 메트릭은 Pod 간의 평균을 내고, 그 평균값을 대상 값과 비교하여 레플리카 수를 조정합니다. 예를 들어, ‘packets-per-second’라는 메트릭이 있다면, 그 값을 특정 임계치와 비교하여 Pod의 수를 조절할 수 있습니다.
- Object 메트릭: 오브젝트 메트릭을 이용해 HPA를 구성할 때, 특정 오브젝트(예: Ingress, Service 등)의 메트릭을 이용합니다. 이는 ‘Value’ 또는 ‘AverageValue’ target 타입을 지원하며, 이들은 각각 API에서 반환된 메트릭 값을 직접적으로 비교하거나, 메트릭 값을 Pod의 수로 나눈 값을 대상 값과 비교하는 방식으로 동작합니다.
type: Object
object:
  metric:
    name: requests-per-second
  describedObject:
    apiVersion: networking.k8s.io/v1
    kind: Ingress
    name: main-route
  target:
    type: Value
    value: 2k
예를 들어, “requests-per-second”라는 오브젝트 메트릭이 있다고 가정해보겠습니다. 이 메트릭은 Ingress 오브젝트 ‘main-route’에 연관되어 있지만, 이 메트릭 값은 실제로는 해당 Ingress 오브젝트에 도달하는 트래픽의 요청 수를 나타냅니다. 이런 값은 일반적으로 로드 밸런서나 인그레스 컨트롤러 같은 외부 시스템에서 모니터링하고 수집합니다.
ingress 의 요청을 수집하려면 별도로 prometheus-adapter를 이용하여 ingress 관련 메트릭을 별도로 수집해야 합니다. 과정이 아주 간단하지 않기때문에, 위 방법은 별도의 문서에서 다뤄보도록 하겠습니다.
코드에 메트릭이 설정된 대상 값이 2k라는 것은, 초당 2000개의 요청이 이 Ingress 오브젝트에 도달했을 때, HPA가 스케일링을 수행하도록 설정되어 있다는 것을 의미합니다.
이 설정은, Ingress ‘main-route’에 도달하는 트래픽이 많아지면, 자동으로 더 많은 Pod를 생성하여 트래픽을 처리하도록 하기 위한 것입니다.
HPA는 이 설정을 보고 Kubernetes API 또는 외부 메트릭 시스템으로부터 해당 메트릭의 현재 값을 가져옵니다. 가져온 현재 메트릭 값과 설정된 대상 값을 비교하고, 필요에 따라 Pod의 수를 증가 또는 감소 시킵니다.
3. 커스텀 메트릭 블록
HPA는 여러 메트릭 블록을 포함할 수 있으며, 이를 통해 여러 메트릭을 기반으로 스케일링 결정을 내릴 수 있습니다. HPA는 각 메트릭에 대해 제안된 레플리카 수를 계산하고, 그중 가장 높은 레플리카 수를 선택합니다. 이를 통해 다양한 메트릭을 종합적으로 고려하여 더욱 정교한 스케일링 결정을 내릴 수 있습니다.
- type: External
  external:
    metric:
      name: queue_messages_ready
      selector:
        matchLabels:
          queue: "worker_tasks"
    target:
      type: AverageValue
      averageValue: 30
CRD처럼 커스텀 메트릭에 의해 HPA 동작 조건을 설정할 수 있습니다.
message queue나 특정 상황의 아키텍처에서 서비스 개발을 할 때 고려해볼 만한 방식의 HPA 조건 설정입니다.
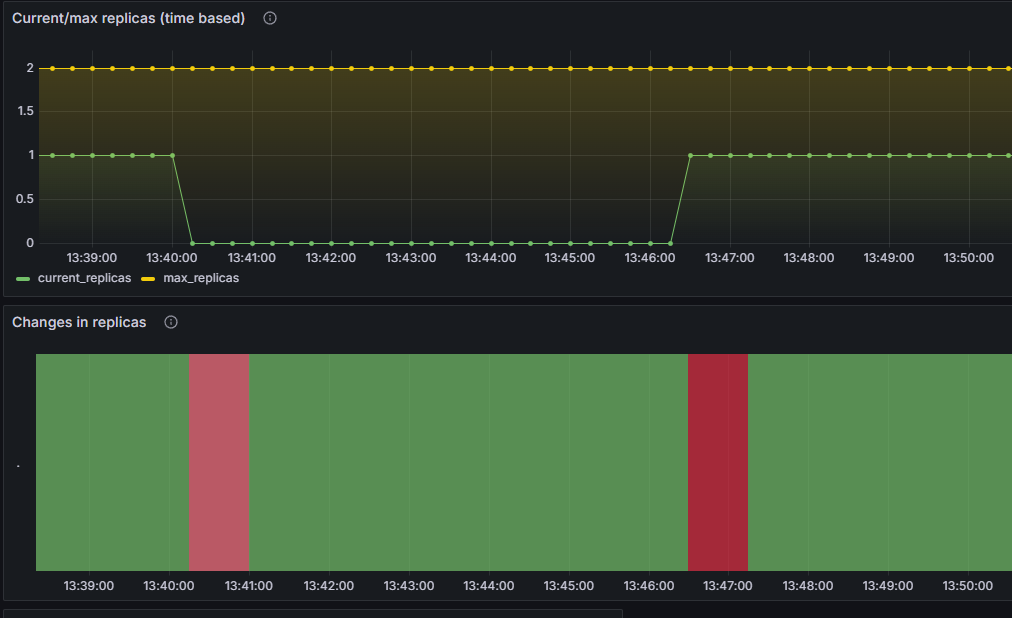
Behavior
autoscaling/v2 부터 (beta는 제외) behavior 필드라는것이 새로 생겼습니다.
스케일 업 동작 / 스케일 다운 동작을 별도로 구성할 수 있습니다.
우선 간단한 예제코드를 보면서 이해를 해보겠습니다.
behavior:
  scaleDown:
    policies:
    - type: Pods
      value: 4
      periodSeconds: 60
    - type: Percent
      value: 10
      periodSeconds: 60
periodSeconds 는 폴리시가 참(true)으로 유지되어야 하는 기간을 나타냅니다.
첫 번째는 (Pods)가 1분 내에 최대 4개의 Replicas를 스케일 다운할 수 있도록 허용하는 정책입니다.
두 번째는 현재 Replicas의 최대 10%를 1분 내에 스케일 다운할 수 있도록 허용하는 정책입니다.
이제 조금 더 종합적으로 여러가지 변수들을 담았습니다.
behavior:
  scaleDown:
    stabilizationWindowSeconds: 300
    policies:
    - type: Pods
      value: 4
      periodSeconds: 60
    - type: Percent
      value: 10
      periodSeconds: 60
  scaleUp:
    stabilizationWindowSeconds: 0
    policies:
    - type: Percent
      value: 100
      periodSeconds: 15
    - type: Pods
      value: 4
      periodSeconds: 15
    selectPolicy: Max
behavior 섹션에는 scaleUp과 scaleDown 두 가지 하위 섹션이 있습니다.
scaleUp: 파드의 수를 늘리는 방식을 제어합니다.scaleDown: 파드의 수를 줄이는 방식을 제어합니다.
각 하위 섹션에는 다음과 같은 필드가 있습니다:
policies: 스케일링 정책을 정의하는 목록입니다. 정책은type,value,periodSeconds세 가지 필드로 구성됩니다.type:Pods또는Percent중 하나를 지정합니다.Pods는 정수의 수를,Percent는 현재 replica 수의 백분율을 나타냅니다.value: 스케일링 기간 동안 최대로 늘릴 수 있는 파드의 수를 나타냅니다.periodSeconds: 스케일링 정책이 적용되는 기간을 초 단위로 나타냅니다.
selectPolicy:Max,Min,Disabled중 하나를 선택합니다.Max는 주어진 시간 동안 가능한 최대 스케일링을,Min은 가능한 최소 스케일링을 나타냅니다.Disabled는 스케일링을 사용하지 않도록 설정합니다.stabilizationWindowSeconds: 스케일링 동작이 안정화되는 시간을 초 단위로 나타냅니다.
각 옵션에따라 조절한 스케일 전략을 미리 구성해둬서 최적화된 pod 확장을 구성해 둘 수 있습니다.
이제 이 Custom Metric 을 쓰기 위해선 prometheus-adapter를 설치해 custom metric 에 대한 수집을 진행합니다. (기존의 CPU / Memory 를 metrics server에서 하던것과 동일한 맥락입니다)
GPU 메트릭에 관련된건 아니겠지만, 마저 이야기를 해보자면 gpu operator으로 배포하는 DCGM Exporter와 동일한 기능이라고 보시면 됩니다.
이제 이 inress count를 기준으로 proemtheus 에서 수집하기위해 다음과 같은 proemtheus rules를 넣은상태로 프로메테우스를 프로비저닝합니다
apiVersion: monitoring.coreos.com/v1
kind: PrometheusRule
metadata:
  name: nginx-ingress-rules
  namespace: monitoring
spec:
  groups:
  - name: nginx-ingress
    rules:
    - record: nginx_ingress_http_requests_total
      expr: sum(rate(nginx_ingress_controller_requests{status=~"2.."}[5m])) by (namespace)
이 설정은 성공적인 HTTP 요청(2XX 상태 코드)의 총 수를 5분 간격으로 계산하고, nginx_ingress_http_requests_total이라는 이름으로 이를 기록합니다. 이 메트릭은 특정 네임스페이스로 그룹화됩니다.
프로메테우스에서 정상적으로 메트릭을 수집할수있는 상태가 된다면, hpa v2의 custom metric을 관리해주는 prometheus adapter의 설정도 같이 변경해줍니다.
rules:
  custom:
  - seriesQuery: 'nginx_ingress_http_requests_total{namespace!="",service!=""}'
    resources:
      template: <<.Resource>>
    name:
      matches: "^(.*)_total"
      as: "${1}_per_second"
    metricsQuery: sum(rate(<<.Series>>{<<.LabelMatchers>>,service=~"<<.Service>>"}[2m])) by (<<.GroupBy>>)
nginx_ingress_http_requests_total 메트릭을 기반으로, 서비스 이름과 일치하는 레이블을 가진 메트릭의 속도(rate)를 계산합니다. 여기서는 2분 동안의 데이터를 사용하여 초당 요청 수를 나타내는 메트릭을 생성합니다.
kubectl get --raw /apis/custom.metrics.k8s.io/v1beta1
명령어를 통해 설정된 메트릭이 잘 수집되고있는지 확인합니다.
이렇게 prometheus rule 과 adapater 설정을 변경하면 hpa에서 설정가능한 custom metric에 대한 설정이 완료됩니다.
위에 설명했던 것과 같은 커스텀 메트릭 블록을 이용한 HPA 설정을 알아보았습니다.
KEDA
Kubernetes Based Event Driven Autoscaler
KEDA(Kubernetes Event-Driven Autoscaling)는 Kubernetes에서 이벤트 기반의 자동 확장을 가능하게 해주는 오픈 소스 프로젝트
KEDA는 Kubernetes 클러스터 내에서 마이크로서비스, 함수, 그리고 이벤트 기반 어플리케이션의 자동 확장을 허용하여, 이벤트의 양(예를 들어, 메시지 큐에 쌓인 메시지의 수, HTTP 요청의 수 등)에 따라 Pod의 수를 동적으로 조절
처음에는 Event Driven이라고 생각해 실제로 쿠버네티스의 Event 기준으로 굉장히 수동적인 오토스케일링을 지원하는줄 알았습니다.
keda-operator-metrics-apiserver 를 이용한 세부지표를 설정해 해당 지표기준으로 오토스케일링을 시킵니다
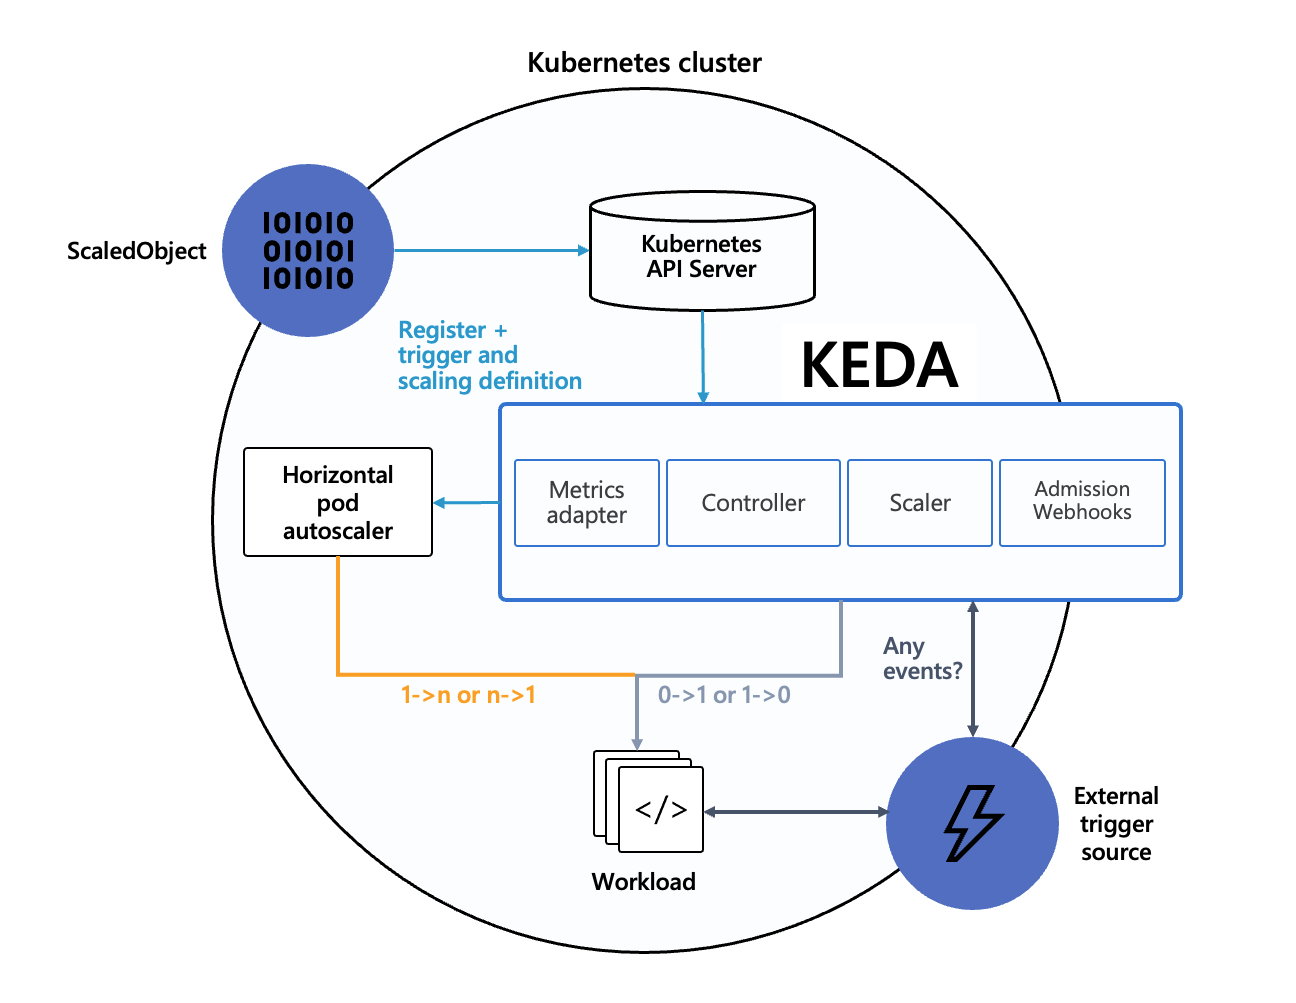
다음과 같은 설계원칙에 의해 만들어졌으며, KEDA를 설치할경우 4개의 CRD가 생성됩니다.
scaledobjects.keda.shscaledjobs.keda.shtriggerauthentications.keda.shclustertriggerauthentications.keda.sh
이러한 CRD들을 이용해 다른 어플리케이션들에서도 확장이 가능해집니다.
VPA
vpa는 악분님 블로그를 참조하여 실습을 진행해보았습니다.
https://malwareanalysis.tistory.com/603
prerequisite
- Metric Server (기존에 설치를 선행했을것으로 예상)
- Grafana
14588Dashboard
EKS에서의 VPA 활성화
- EKS에서 제공한 쉘 스크립트로 VPA Controller 설치를 진행합니다.
git clone https://github.com/kubernetes/autoscaler.git
cd autoscaler/vertical-pod-autoscaler/
./hack/vpa-up.sh
EKS 공식 예제를 이용해 VPA 설정이 되어있는 pod를 배포해봅니다.
git clone https://github.com/kubernetes/autoscaler.git
cd autoscaler/vertical-pod-autoscaler/
kubectl apply -f examples/hamster.yaml
VPA 리소스를 조회하면, 시스템 내부적으로 계산된 최적의 다음 Vertical Scale 사이즈를 계산하여 알려줍니다.
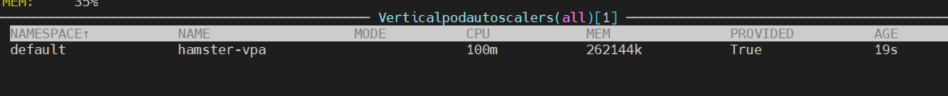

기존에 설정된 resource 기준으로 현재 가용자산을 적당히 고려하여 추천 리소스를 선정합니다.
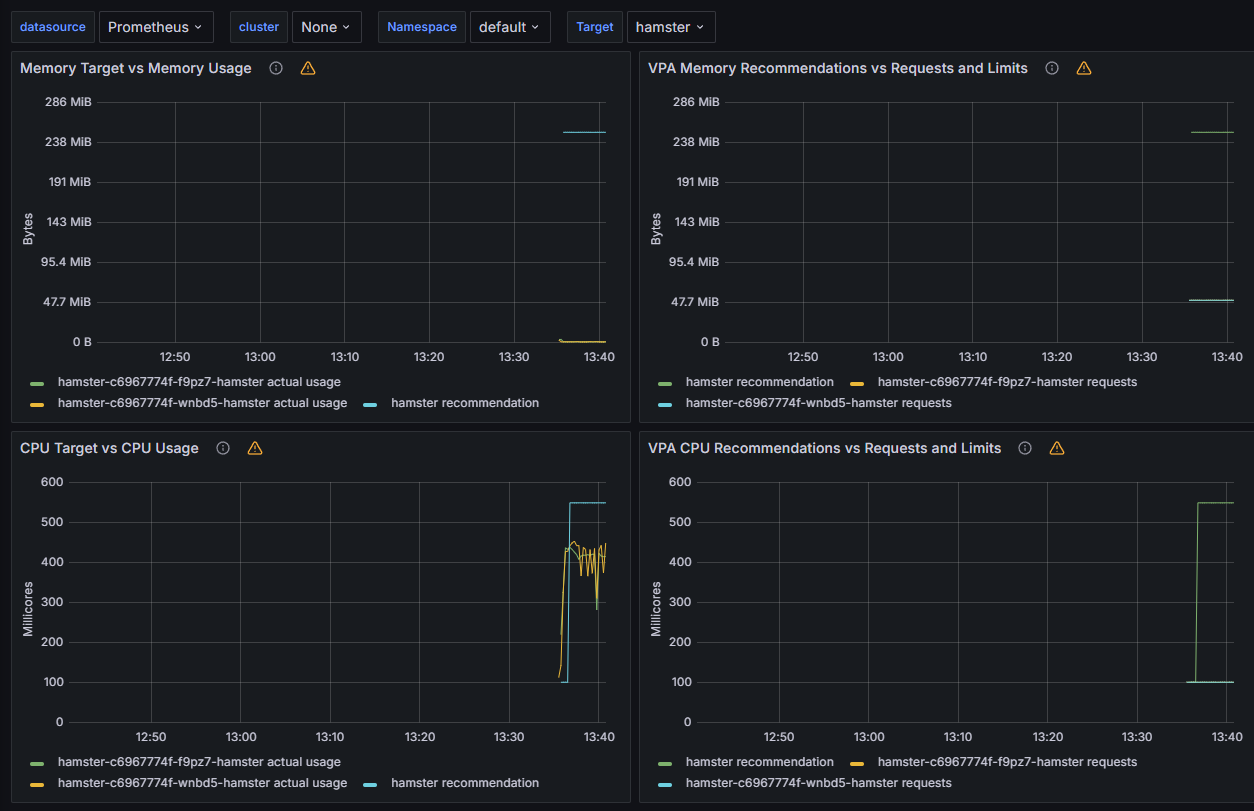
메트릭들을 기준으로 변경되는 메트릭 기반으로 VPA 리소스를 계산하는 대시보드입니다.
구체적인 알고리즘은 공개되어있는게 없지만, VPA 소스를 보면 조금 이해하기 쉽지않을까 싶네요.
해당 코드에 조금 힌트가 들어있는듯 합니다,
Inplace Pod Resizing
V1.27에서 Alpha 로 들어온 FeatureGate인 “파드 재시작 없는 VPA” 의 개념입니다.
cgroup을 조절하여 CPU / Memory 를 변경 시키는것으로 보이며 개념자체는 특별할게 없지만, 이제서야 들어온게 조금 아쉬울뿐이네요
다만 아직 검증해야될 부분들이 많아 일부 리사이징시 Restart Policy 로 재시작을 권장하는 경우도 있고, 실제로 EKS에서는 Featuregate 의 Beta 부터 사용이 가능하므로 조금 더 stable 하게 돌아가는것을 지켜봐야할것같습니다.
https://montkim.com/podresizing
예전부터 Cgroup 값을 조절하면서 온갖 쿠버네티스 시스템을 마개조하는 프로젝트들을 찾아봤었는데, alibaba cloud에서 이러한 오픈소스 프로젝트에 꽤 기여를 많이하는거같습니다.
이러한 기능도 같이 본적이있는데, cgroup v2에서는 지원이 안되는것같습니다.
이제 Pod들의 Autoscaling 에 대해 다루었다면, 이제는 노드의 Autoscaling에 대해 다뤄보겠습니다
Cluster Autoscaler
Cluster Autoscaler는 Amazon EC2 Auto Scaling 그룹을 활용하여 노드 그룹을 관리합니다
# EKS 노드에 이미 아래 tag가 들어가 있음
# k8s.io/cluster-autoscaler/enabled : true
# k8s.io/cluster-autoscaler/myeks : owned
aws ec2 describe-instances  --filters Name=tag:Name,Values=$CLUSTER_NAME-ng1-Node --query "Reservations[*].Instances[*].Tags[*]" --output yaml | yh
...
- Key: k8s.io/cluster-autoscaler/myeks
      Value: owned
- Key: k8s.io/cluster-autoscaler/enabled
      Value: 'true'
...
프로비저닝 한 노드에는 이미 Cluster Autoscaler태그가 활성화 되어있습니다.
별도로 설치를 하게된다면, IRSA 또는 다른방법으로 자격증명을 통해 노드를 프로비저닝 할 수 있는 권한이 필요하겠네요.
현재 프로비저닝 된 ASG의 경우 추가적인 오토스케일링이 일어나지않게 min = max (pod 의 guarante 클래스같아보이는군요) 로 설정이 되어있습니다.
# 현재 autoscaling(ASG) 정보 확인
# aws autoscaling describe-auto-scaling-groups --query "AutoScalingGroups[? Tags[? (Key=='eks:cluster-name') && Value=='클러스터이름']].[AutoScalingGroupName, MinSize, MaxSize,DesiredCapacity]" --output table
aws autoscaling describe-auto-scaling-groups \
    --query "AutoScalingGroups[? Tags[? (Key=='eks:cluster-name') && Value=='myeks']].[AutoScalingGroupName, MinSize, MaxSize,DesiredCapacity]" \
    --output table

-----------------------------------------------------------------
|                   DescribeAutoScalingGroups                   |
+------------------------------------------------+----+----+----+
|  eks-ng1-5cc74e31-88a2-1adc-e9c3-b8ee7899953c  |  3 |  3 |  3 |
+------------------------------------------------+----+----+----+

export ASG_NAME=$(aws autoscaling describe-auto-scaling-groups --query "AutoScalingGroups[? Tags[? (Key=='eks:cluster-name') && Value=='myeks']].AutoScalingGroupName" --output text)
aws autoscaling update-auto-scaling-group --auto-scaling-group-name ${ASG_NAME} --min-size 3 --desired-capacity 3 --max-size 6

#변경 후 조회
-----------------------------------------------------------------
|                   DescribeAutoScalingGroups                   |
+------------------------------------------------+----+----+----+
|  eks-ng1-5cc74e31-88a2-1adc-e9c3-b8ee7899953c  |  3 |  6 |  3 |
+------------------------------------------------+----+----+----+
오토스케일링이 가능하게 MAX Node를 수정하였습니다.
Cluster Autoscaler 배포
curl -s -O https://raw.githubusercontent.com/kubernetes/autoscaler/master/cluster-autoscaler/cloudprovider/aws/examples/cluster-autoscaler-autodiscover.yaml
sed -i "s/<YOUR CLUSTER NAME>/$CLUSTER_NAME/g" cluster-autoscaler-autodiscover.yaml
kubectl apply -f cluster-autoscaler-autodiscover.yaml

# 확인
kubectl get pod -n kube-system | grep cluster-autoscaler
kubectl describe deployments.apps -n kube-system cluster-autoscaler
kubectl describe deployments.apps -n kube-system cluster-autoscaler | grep node-group-auto-discovery
      --node-group-auto-discovery=asg:tag=k8s.io/cluster-autoscaler/enabled,k8s.io/cluster-autoscaler/myeks

# (옵션) cluster-autoscaler 파드가 동작하는 워커 노드가 퇴출(evict) 되지 않게 설정
kubectl -n kube-system annotate deployment.apps/cluster-autoscaler cluster-autoscaler.kubernetes.io/safe-to-evict="false"
자원이 부족한 상태를 만들기 위해 nginx deployment를 배포하고
scale 명령어로 replicaset을 조절합니다. 자원이 부족해지자 nodegroup 의 scale up을 실행합니다
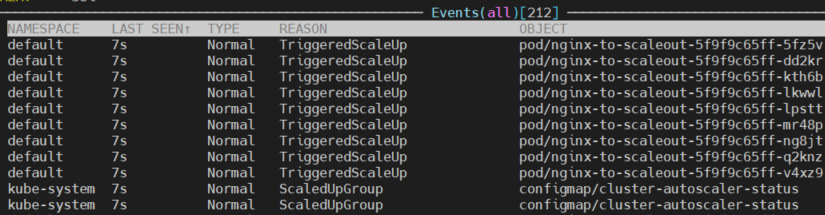
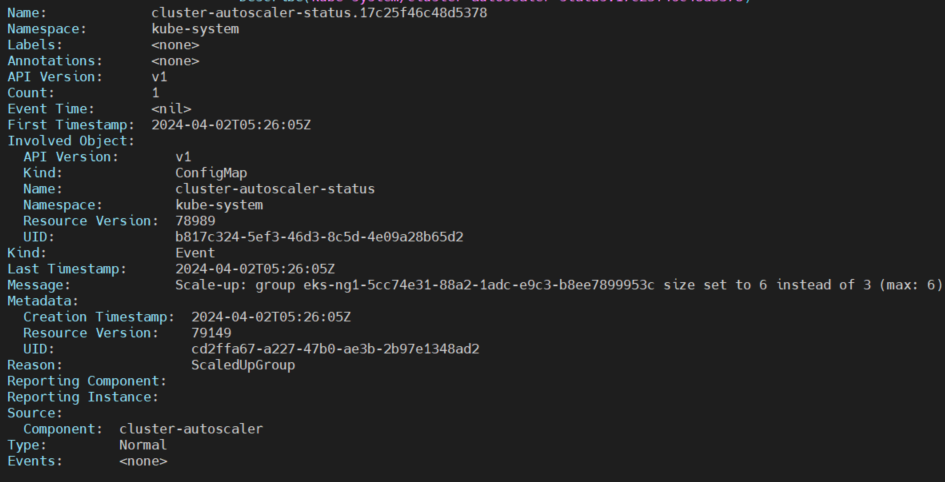
쿠버네티스 event로 일어나는 동작들을 확인 할 수 있습니다.
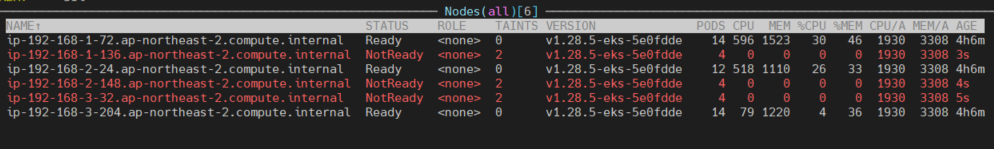
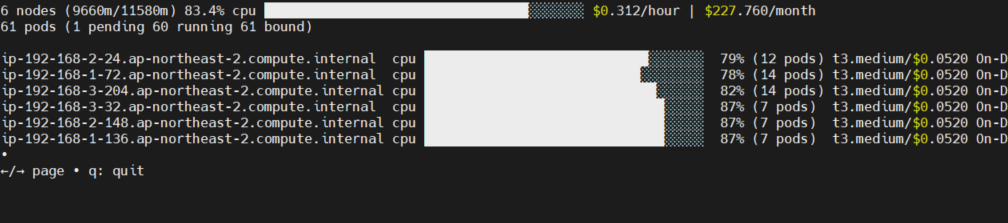
시간이 조금 흐른뒤 증가되는 node들, 그리고 배치되는 pod들을 볼 수 있습니다.
시간이 지난 뒤 자동으로 scale down이 이루어지는데 필요한 시간은 10분입니다.
이 수치는 변경이 가능하지만, node 단위의 scale down은 다시 scale up에 시간이 걸리기때문에 보수적으로 잡은듯 합니다.
idle로 판단하여 scale down을 결정하는 기준으로는 treshhold값이 있습니다.
scale-down-utilization-threshold 를 설정하여 Pod Request 총합 / 노드사용량 기준으로 idle 노드를 판별합니다. 사용하는 환경에 맞는 threshold 값을 계산하여 설정하는것이 필요하다고 생각되네요.
CPA
Cluster Proportional Autoscaler
클러스터의 전체적인 규모를 고려하여 노드 수에 비례하게 성능 처리가 필요한 어플리케이션을 Horizon하게 확장시키는 Autoscaler입니다.
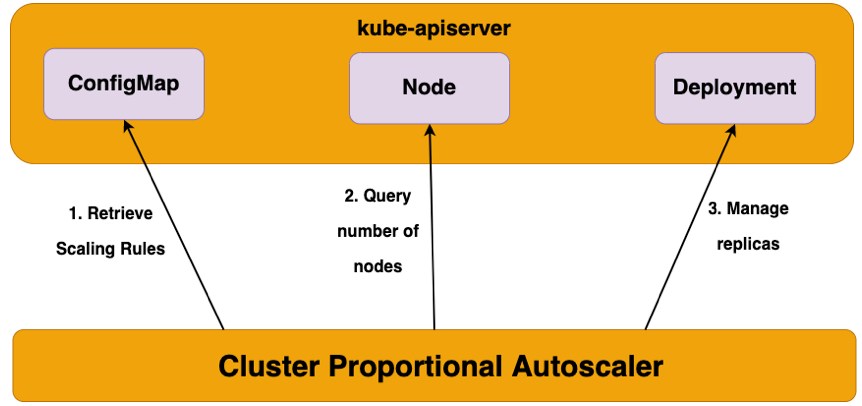
대표적인 예시가 core dns의 cluter 단위 autoscaling인데, 공식 document를 보고 진행해보겠습니다
https://kubernetes.io/docs/tasks/administer-cluster/dns-horizontal-autoscaling/
kind: ServiceAccount
apiVersion: v1
metadata:
  name: kube-dns-autoscaler
  namespace: kube-system
---
kind: ClusterRole
apiVersion: rbac.authorization.k8s.io/v1
metadata:
  name: system:kube-dns-autoscaler
rules:
  - apiGroups: [""]
    resources: ["nodes"]
    verbs: ["list", "watch"]
  - apiGroups: [""]
    resources: ["replicationcontrollers/scale"]
    verbs: ["get", "update"]
  - apiGroups: ["apps"]
    resources: ["deployments/scale", "replicasets/scale"]
    verbs: ["get", "update"]
# Remove the configmaps rule once below issue is fixed:
# kubernetes-incubator/cluster-proportional-autoscaler#16
  - apiGroups: [""]
    resources: ["configmaps"]
    verbs: ["get", "create"]
---
kind: ClusterRoleBinding
apiVersion: rbac.authorization.k8s.io/v1
metadata:
  name: system:kube-dns-autoscaler
subjects:
  - kind: ServiceAccount
    name: kube-dns-autoscaler
    namespace: kube-system
roleRef:
  kind: ClusterRole
  name: system:kube-dns-autoscaler
  apiGroup: rbac.authorization.k8s.io

---
apiVersion: apps/v1
kind: Deployment
metadata:
  name: kube-dns-autoscaler
  namespace: kube-system
  labels:
    k8s-app: kube-dns-autoscaler
    kubernetes.io/cluster-service: "true"
spec:
  selector:
    matchLabels:
      k8s-app: kube-dns-autoscaler
  template:
    metadata:
      labels:
        k8s-app: kube-dns-autoscaler
    spec:
      priorityClassName: system-cluster-critical
      securityContext:
        seccompProfile:
          type: RuntimeDefault
        supplementalGroups: [ 65534 ]
        fsGroup: 65534
      nodeSelector:
        kubernetes.io/os: linux
      containers:
      - name: autoscaler
        image: registry.k8s.io/cpa/cluster-proportional-autoscaler:1.8.4
        resources:
            requests:
                cpu: "20m"
                memory: "10Mi"
        command:
          - /cluster-proportional-autoscaler
          - --namespace=kube-system
          - --configmap=kube-dns-autoscaler
          # Should keep target in sync with cluster/addons/dns/kube-dns.yaml.base
          - --target=Deployment/coredns
          # When cluster is using large nodes(with more cores), "coresPerReplica" should dominate.
          # If using small nodes, "nodesPerReplica" should dominate.
          - --default-params={"linear":{"coresPerReplica":256,"nodesPerReplica":16,"preventSinglePointFailure":true,"includeUnschedulableNodes":true}}
          - --logtostderr=true
          - --v=2
      tolerations:
      - key: "CriticalAddonsOnly"
        operator: "Exists"
      serviceAccountName: kube-dns-autoscaler
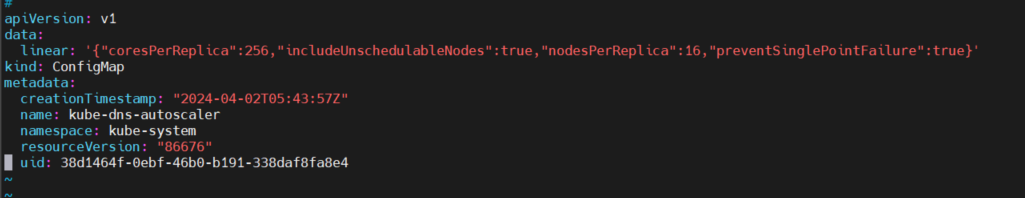
배포된 파일의 Configmap에 해당 CPA 설정이 들어있습니다.
전체 코어, 노드 당 권장 dns pod의 replicaset을 설정해줍니다.
이 경우엔 256코어당 coredns pod 한개씩, 혹은 노드가 16개 증가할때 coredns pod 한개씩 늘리는 설정인데, EKS 시스템같은경우엔 내부적인 dns가 온프레미스만큼 많이호출되지않기때문에, 사용량이 그렇게 많지 않을것으로 예상됩니다.
임의로 nodesPerReplica를 1로 설정해 노드 한개당 coredns 파드 한개씩 생성되게 설정을 진행해봤습니다.
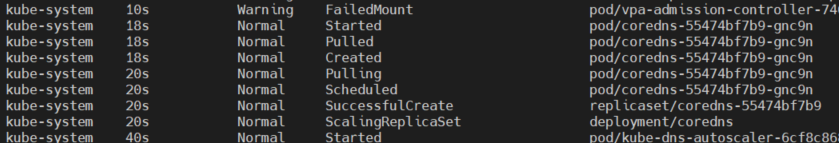

사전에 설정을 해두면 쾌적한 클러스터를 이용 가능할거같은 사소한 기능으로 예상이됩니다.
Cluster Autoscaler를 사용할경우 pending event 가 발생된 시점으로만 node의 autoscaling이 결정되며, AWS Resource와도 desired state 와 real state가 다른경우가 발생이됩니다.
심지어 pulling 방식으로 프로비저닝 여부에만 관여하고 실제로 정보들이 동기화가 안되는 경우가 발생됩니다.
노드의 사용빈도를 확인해 조절하는 정책도 없고, 꽤 주먹구구식으로 동작합니다.
솔직히 이정도면 RBAC, IRSA 에 대한 이해도가 있으면 event 기반으로 동작하는 소스를 직접 만들수도 있지않을까 싶은데…
그래서 Karpenter가 나왔고 다음단원으로 넘어가겠습니다
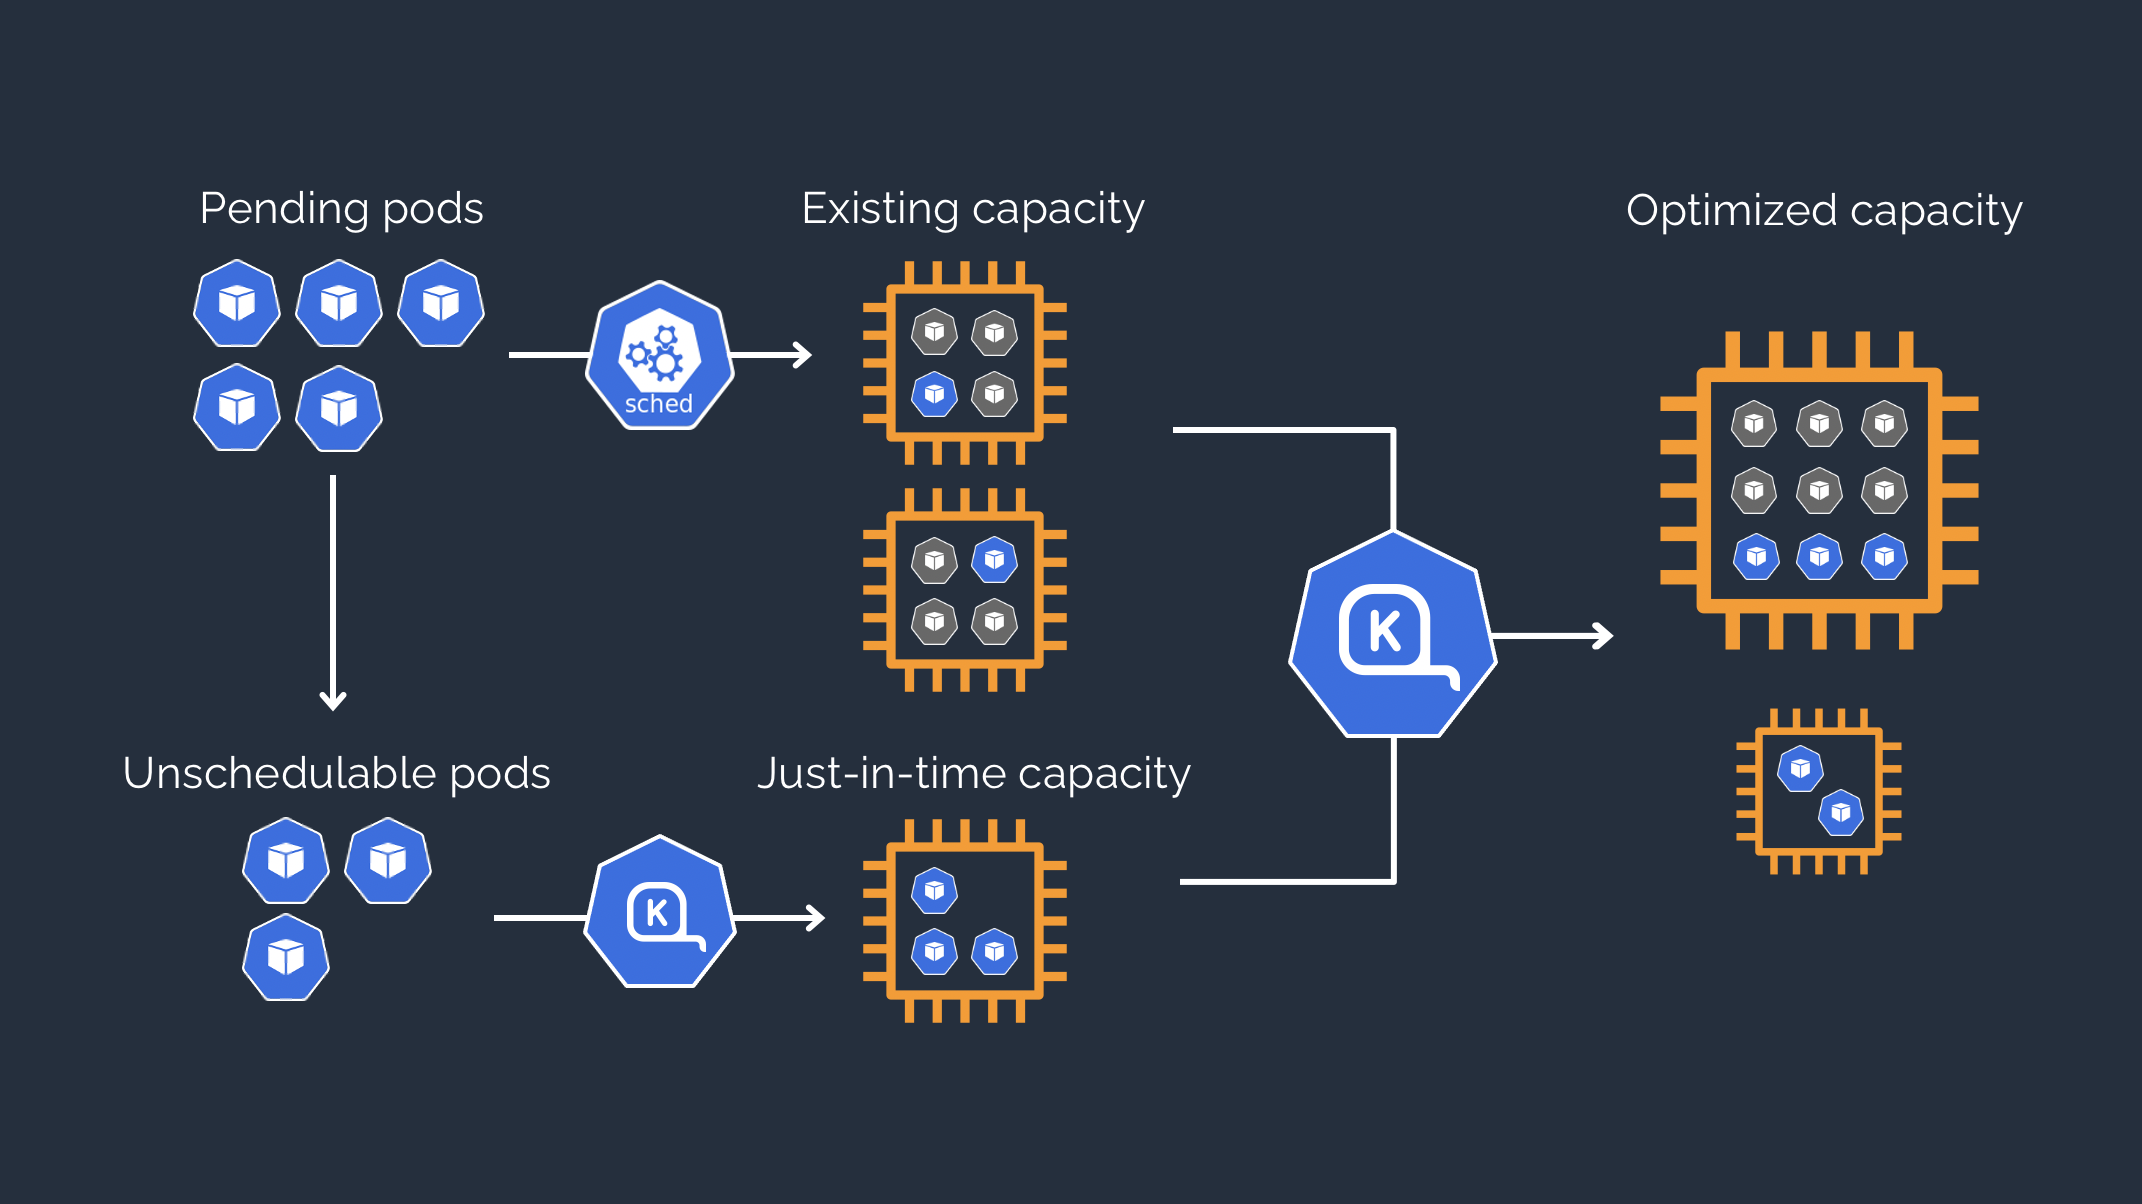
Karpenter
Cluster Autoscaler에 이은 오픈소스 노드 수명 주기 및 관리 솔루션입니다.
CRD 형태로 노드를 관리하며 굉장히 빠르다는 장점이 있습니다.
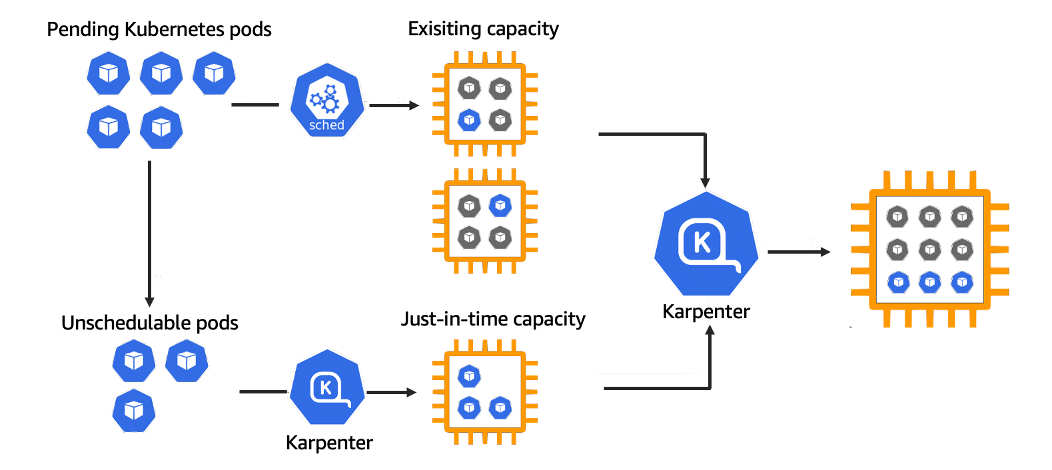
https://karpenter.sh/karpenter-overview.pnghttps://karpenter.sh/karpenter-overview.png
pod에 필요한 노드중 “제일 저렴한” 노드를 검색하여 프로비저닝하고 관리해줍니다.
PV는 서브넷 종속적이기때문에 서브넷또한 맞춰 프로비저닝해주고, 사용하지 않는 노드를 제거해줍니다.
떠있는 파드들을 옆 노드로 옮기면서 노드갯수를 줄일 수 있다면, 이또한 가능합니다.
큰 노드 하나를 새로 프로비저닝하여 작은 노드 여러개를 삭제하여 비용 절감이 가능하다면 이또한 가능하고 신기한 기능이 참 많네요
신규 karpenter를 이용하기위해서는 새로운 EKS 클러스터를 만들어봅니다.
# YAML 파일 다운로드
curl -O https://s3.ap-northeast-2.amazonaws.com/cloudformation.cloudneta.net/K8S/karpenter-preconfig.yaml

# CloudFormation 스택 배포
예시) aws cloudformation deploy --template-file karpenter-preconfig.yaml --stack-name myeks2 --parameter-overrides KeyName=kp-gasida SgIngressSshCidr=$(curl -s ipinfo.io/ip)/32  MyIamUserAccessKeyID=AKIA5... MyIamUserSecretAccessKey='CVNa2...' ClusterBaseName=myeks2 --region ap-northeast-2

# CloudFormation 스택 배포 완료 후 작업용 EC2 IP 출력
aws cloudformation describe-stacks --stack-name myeks2 --query 'Stacks[*].Outputs[0].OutputValue' --output text

# 작업용 EC2 SSH 접속
ssh -i ~/.ssh/kp-gasida.pem ec2-user@$(aws cloudformation describe-stacks --stack-name myeks2 --query 'Stacks[*].Outputs[0].OutputValue' --output text)

# 변수 정보 확인
export | egrep 'ACCOUNT|AWS_' | egrep -v 'SECRET|KEY'

# 변수 설정
export KARPENTER_NAMESPACE="kube-system"
export K8S_VERSION="1.29"
export KARPENTER_VERSION="0.35.2"
export TEMPOUT=$(mktemp)
export ARM_AMI_ID="$(aws ssm get-parameter --name /aws/service/eks/optimized-ami/${K8S_VERSION}/amazon-linux-2-arm64/recommended/image_id --query Parameter.Value --output text)"
export AMD_AMI_ID="$(aws ssm get-parameter --name /aws/service/eks/optimized-ami/${K8S_VERSION}/amazon-linux-2/recommended/image_id --query Parameter.Value --output text)"
export GPU_AMI_ID="$(aws ssm get-parameter --name /aws/service/eks/optimized-ami/${K8S_VERSION}/amazon-linux-2-gpu/recommended/image_id --query Parameter.Value --output text)"
export AWS_PARTITION="aws"
export CLUSTER_NAME="${USER}-karpenter-demo"
echo "export CLUSTER_NAME=$CLUSTER_NAME" >> /etc/profile
echo $KARPENTER_VERSION $CLUSTER_NAME $AWS_DEFAULT_REGION $AWS_ACCOUNT_ID $TEMPOUT $ARM_AMI_ID $AMD_AMI_ID $GPU_AMI_ID

# CloudFormation 스택으로 IAM Policy, Role(KarpenterNodeRole-myeks2) 생성 : 3분 정도 소요
curl -fsSL https://raw.githubusercontent.com/aws/karpenter-provider-aws/v"${KARPENTER_VERSION}"/website/content/en/preview/getting-started/getting-started-with-karpenter/cloudformation.yaml  > "${TEMPOUT}" \
&& aws cloudformation deploy \
  --stack-name "Karpenter-${CLUSTER_NAME}" \
  --template-file "${TEMPOUT}" \
  --capabilities CAPABILITY_NAMED_IAM \
  --parameter-overrides "ClusterName=${CLUSTER_NAME}"

# 클러스터 생성 : myeks2 EKS 클러스터 생성 19분 정도 소요
eksctl create cluster -f - <<EOF
---
apiVersion: eksctl.io/v1alpha5
kind: ClusterConfig
metadata:
  name: ${CLUSTER_NAME}
  region: ${AWS_DEFAULT_REGION}
  version: "${K8S_VERSION}"
  tags:
    karpenter.sh/discovery: ${CLUSTER_NAME}

iam:
  withOIDC: true
  serviceAccounts:
  - metadata:
      name: karpenter
      namespace: "${KARPENTER_NAMESPACE}"
    roleName: ${CLUSTER_NAME}-karpenter
    attachPolicyARNs:
    - arn:${AWS_PARTITION}:iam::${AWS_ACCOUNT_ID}:policy/KarpenterControllerPolicy-${CLUSTER_NAME}
    roleOnly: true

iamIdentityMappings:
- arn: "arn:${AWS_PARTITION}:iam::${AWS_ACCOUNT_ID}:role/KarpenterNodeRole-${CLUSTER_NAME}"
  username: system:node:
  groups:
  - system:bootstrappers
  - system:nodes

managedNodeGroups:
- instanceType: m5.large
  amiFamily: AmazonLinux2
  name: ${CLUSTER_NAME}-ng
  desiredCapacity: 2
  minSize: 1
  maxSize: 10
  iam:
    withAddonPolicies:
      externalDNS: true
EOF

# eks 배포 확인
eksctl get cluster
eksctl get nodegroup --cluster $CLUSTER_NAME
eksctl get iamidentitymapping --cluster $CLUSTER_NAME
eksctl get iamserviceaccount --cluster $CLUSTER_NAME
eksctl get addon --cluster $CLUSTER_NAME

# default 네임스페이스 적용
kubectl ns default

# 노드 정보 확인
kubectl get node --label-columns=node.kubernetes.io/instance-type,eks.amazonaws.com/capacityType,topology.kubernetes.io/zone

# ExternalDNS
MyDomain=<자신의 도메인>
echo "export MyDomain=<자신의 도메인>" >> /etc/profile
MyDomain=gasida.link
echo "export MyDomain=gasida.link" >> /etc/profile
MyDnzHostedZoneId=$(aws route53 list-hosted-zones-by-name --dns-name "${MyDomain}." --query "HostedZones[0].Id" --output text)
echo $MyDomain, $MyDnzHostedZoneId
curl -s -O https://raw.githubusercontent.com/gasida/PKOS/main/aews/externaldns.yaml
MyDomain=$MyDomain MyDnzHostedZoneId=$MyDnzHostedZoneId envsubst < externaldns.yaml | kubectl apply -f -

# kube-ops-view
helm repo add geek-cookbook https://geek-cookbook.github.io/charts/
helm install kube-ops-view geek-cookbook/kube-ops-view --version 1.2.2 --set env.TZ="Asia/Seoul" --namespace kube-system
kubectl patch svc -n kube-system kube-ops-view -p '{"spec":{"type":"LoadBalancer"}}'
kubectl annotate service kube-ops-view -n kube-system "external-dns.alpha.kubernetes.io/hostname=kubeopsview.$MyDomain"
echo -e "Kube Ops View URL = http://kubeopsview.$MyDomain:8080/#scale=1.5"

# [터미널1] eks-node-viewer
cd ~/go/bin && ./eks-node-viewer --resources cpu,memory

# k8s 확인
kubectl cluster-info
kubectl get node --label-columns=node.kubernetes.io/instance-type,eks.amazonaws.com/capacityType,topology.kubernetes.io/zone
kubectl get pod -n kube-system -owide
kubectl describe cm -n kube-system aws-auth

# Karpenter 설치를 위한 변수 설정 및 확인
export CLUSTER_ENDPOINT="$(aws eks describe-cluster --name "${CLUSTER_NAME}" --query "cluster.endpoint" --output text)"
export KARPENTER_IAM_ROLE_ARN="arn:${AWS_PARTITION}:iam::${AWS_ACCOUNT_ID}:role/${CLUSTER_NAME}-karpenter"
echo "${CLUSTER_ENDPOINT} ${KARPENTER_IAM_ROLE_ARN}"

# EC2 Spot Fleet의 service-linked-role 생성 확인 : 만들어있는것을 확인하는 거라 아래 에러 출력이 정상!
# If the role has already been successfully created, you will see:
# An error occurred (InvalidInput) when calling the CreateServiceLinkedRole operation: Service role name AWSServiceRoleForEC2Spot has been taken in this account, please try a different suffix.
aws iam create-service-linked-role --aws-service-name spot.amazonaws.com || true

# docker logout : Logout of docker to perform an unauthenticated pull against the public ECR
docker logout public.ecr.aws

# helm registry logout
helm registry logout public.ecr.aws

# karpenter 설치
helm install karpenter oci://public.ecr.aws/karpenter/karpenter --version "${KARPENTER_VERSION}" --namespace "${KARPENTER_NAMESPACE}" --create-namespace \
  --set "serviceAccount.annotations.eks\.amazonaws\.com/role-arn=${KARPENTER_IAM_ROLE_ARN}" \
  --set "settings.clusterName=${CLUSTER_NAME}" \
  --set "settings.interruptionQueue=${CLUSTER_NAME}" \
  --set controller.resources.requests.cpu=1 \
  --set controller.resources.requests.memory=1Gi \
  --set controller.resources.limits.cpu=1 \
  --set controller.resources.limits.memory=1Gi \
  --wait

# 확인
kubectl get-all -n $KARPENTER_NAMESPACE
kubectl get all -n $KARPENTER_NAMESPACE
kubectl get crd | grep karpenter

# APi 변경
v1alpha5/Provisioner → v1beta1/NodePool
v1alpha1/AWSNodeTemplate → v1beta1/EC2NodeClass
v1alpha5/Machine → v1beta1/NodeClaim
프로비저닝을 완료한 후, Karpenter로 조회 가능한 Grafana Dashboard 를 위해 prometheus 를 설치합니다
#
helm repo add grafana-charts https://grafana.github.io/helm-charts
helm repo add prometheus-community https://prometheus-community.github.io/helm-charts
helm repo update
kubectl create namespace monitoring

# 프로메테우스 설치
curl -fsSL https://raw.githubusercontent.com/aws/karpenter-provider-aws/v"${KARPENTER_VERSION}"/website/content/en/preview/getting-started/getting-started-with-karpenter/prometheus-values.yaml | envsubst | tee prometheus-values.yaml
helm install --namespace monitoring prometheus prometheus-community/prometheus --values prometheus-values.yaml

# 그라파나 설치
curl -fsSL https://raw.githubusercontent.com/aws/karpenter-provider-aws/v"${KARPENTER_VERSION}"/website/content/en/preview/getting-started/getting-started-with-karpenter/grafana-values.yaml | tee grafana-values.yaml
helm install --namespace monitoring grafana grafana-charts/grafana --values grafana-values.yaml
kubectl patch svc -n monitoring grafana -p '{"spec":{"type":"LoadBalancer"}}'

# admin 암호
kubectl get secret --namespace monitoring grafana -o jsonpath="{.data.admin-password}" | base64 --decode ; echo

# 그라파나 접속
kubectl annotate service grafana -n monitoring "external-dns.alpha.kubernetes.io/hostname=grafana.$MyDomain"
echo -e "grafana URL = http://grafana.$MyDomain"
환결설정 완료 후 Grafana Dashboard를 import해줍니다.
16236 pod statistic 대시보드를 이용했습니다.
위에서 HPA 테스트에 이용했던 nginx test pod를 다시 조절해봅니다.
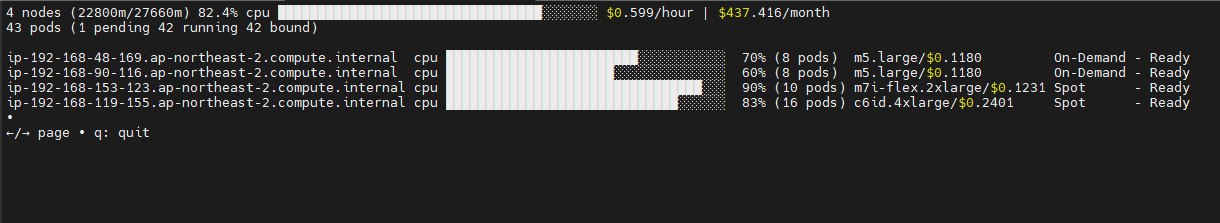
scale을 과하게 높게 설정하니, 4xlarge라는 큰 노드가 배정되어 노드자체가 많이 프로비저닝되지는 않았습니다.
다시 적당한 scale로 조절해보면
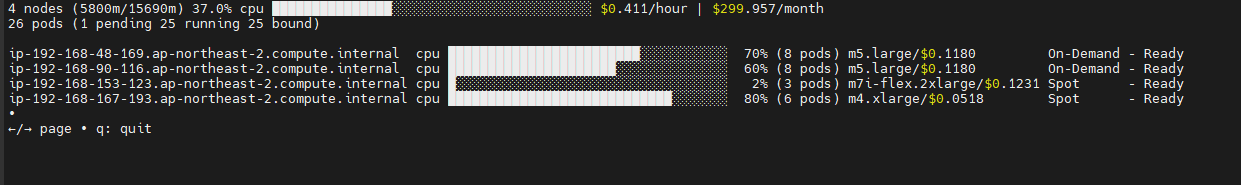
현재 가용한 노드들이 유동적으로 변경되는것을 확인 할 수 있습니다.
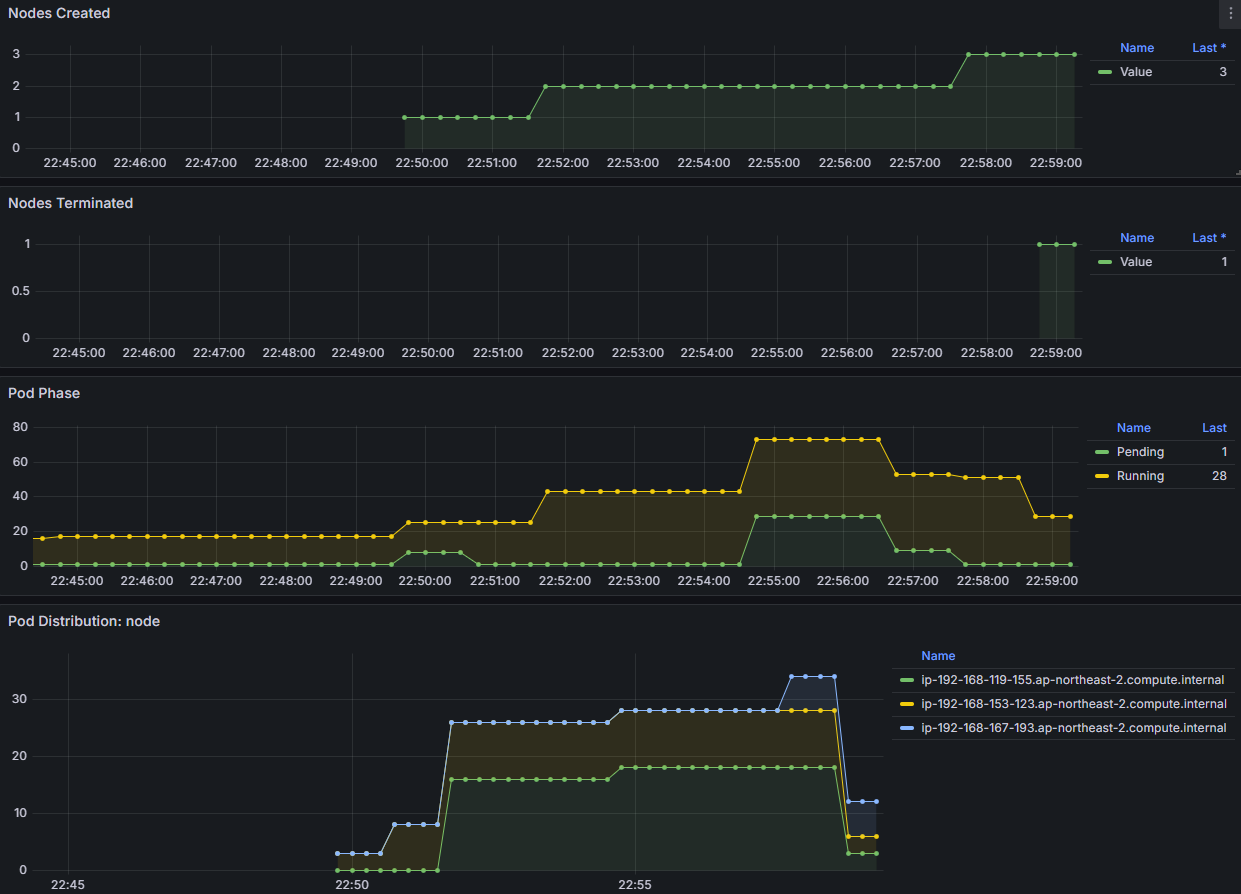
노드의 변경정보들을 Grafana로 모니터링이 가능합니다.
Spot to Spot Consolidation
기존의 spot 인스턴스에서 spot 인스턴스로 pod들을 옮겨주는 기능이 v0.34.0 부터 생겨 활성화를 해보려합니다.
| [Applying Spot-to-Spot consolidation best practices with Karpenter | Amazon Web Services](https://aws.amazon.com/ko/blogs/compute/applying-spot-to-spot-consolidation-best-practices-with-karpenter/) |
# 기존 nodepool 삭제
kubectl delete nodepool,ec2nodeclass default

# v0.34.0 부터 featureGates 에 spotToSpotConsolidation 활성화로 사용 가능
helm upgrade karpenter -n kube-system oci://public.ecr.aws/karpenter/karpenter --reuse-values --set settings.featureGates.spotToSpotConsolidation=true

# Create a Karpenter NodePool and EC2NodeClass
cat <<EOF > nodepool.yaml
apiVersion: karpenter.sh/v1beta1
kind: NodePool
metadata:
  name: default
spec:
  template:
    metadata:
      labels:
        intent: apps
    spec:
      nodeClassRef:
        name: default
      requirements:
        - key: karpenter.sh/capacity-type
          operator: In
          values: ["spot"]
        - key: karpenter.k8s.aws/instance-category
          operator: In
          values: ["c","m","r"]
        - key: karpenter.k8s.aws/instance-size
          operator: NotIn
          values: ["nano","micro","small","medium"]
        - key: karpenter.k8s.aws/instance-hypervisor
          operator: In
          values: ["nitro"]
  limits:
    cpu: 100
    memory: 100Gi
  disruption:
    consolidationPolicy: WhenUnderutilized
---
apiVersion: karpenter.k8s.aws/v1beta1
kind: EC2NodeClass
metadata:
  name: default
spec:
  amiFamily: Bottlerocket
  subnetSelectorTerms:
    - tags:
        karpenter.sh/discovery: "${CLUSTER_NAME}" # replace with your cluster name
  securityGroupSelectorTerms:
    - tags:
        karpenter.sh/discovery: "${CLUSTER_NAME}" # replace with your cluster name
  role: "KarpenterNodeRole-${CLUSTER_NAME}" # replace with your cluster name
  tags:
    Name: karpenter.sh/nodepool/default
    IntentLabel: "apps"
EOF
kubectl apply -f nodepool.yaml
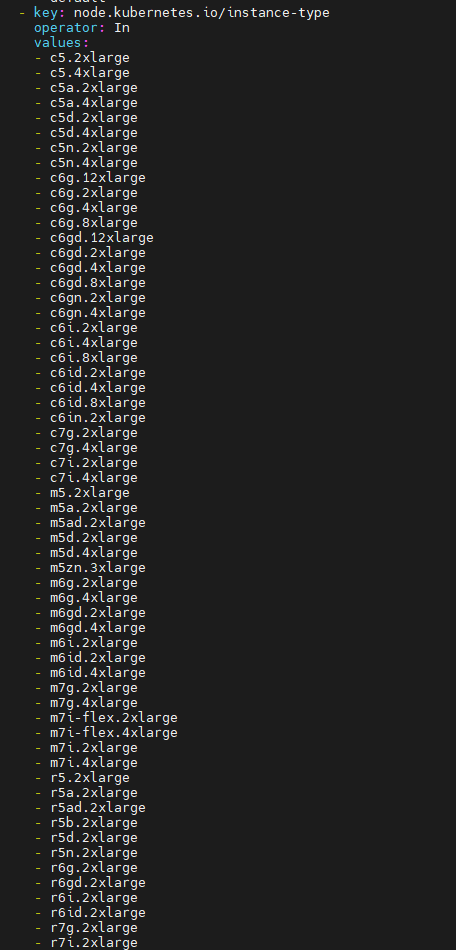
다음과 같이 생성가능한 리소스들은 configmap에 생성 가능한 인스턴스들을 등록해 해당 노드들을 검색합니다.
이제 consolidation이 발생되는것을 확인해보겠습니다.
consolidation 기능은 과거에 disruption 이라는 이름이였으며 실제로 kubernetes event에서는 disruption이라는 이름으로 발생이됩니다.
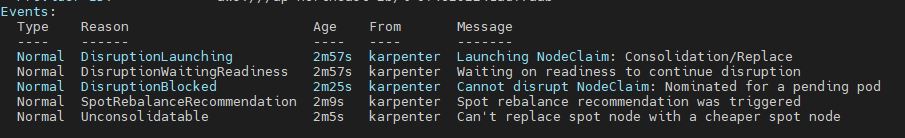
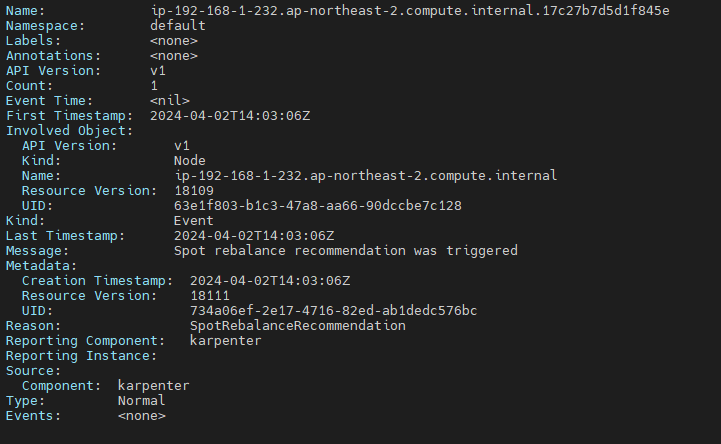
다음과 같은 상세한 Event 내용을 통해 Spot Rebalancing이 필요해 disruption이 이루어졌다는 것을 확인 할 수 있습니다.